
Over the last few weeks, we’ve been compiling some of the most exciting indicators in the Canadian Real Estate market.
We don’t have a crystal ball – but understanding where the market is & has been is the best way to project where we think the market is going to go in the future.
It’s essential to ignore media sensationalism and let the fundamentals help guide your perception of the market – in other words, let the numbers do the talking. It’s especially important to get the housing market figures from reputable resources, such as the Canadian Real Estate Association (CREA).
Real Estate & Canadians Net Worth
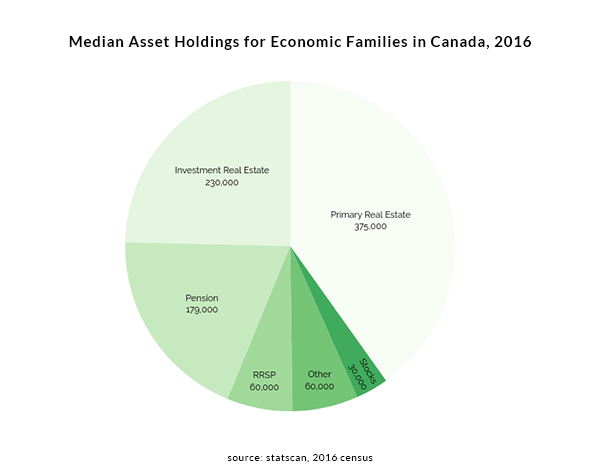
The Average Canadian net worth is tied up overwhelmingly in Real Estate
- The Median net worth for economic families in Canada was $478,600 in 2016 [¹]
- By comparison, the median net worth of a family in the USA is 97,300 [²]
- On average, $595K of that is tied up in primary or investment real estate, less 200K in average mortgage debt (leaving 395K in equity) [³]
- This means that the average Canadian has 60%+ of their net worth in Canadian Real Estate
- There are 1,322,000 millionaires in Canada as of 2019 – 1 in 28 of the population [⁴]
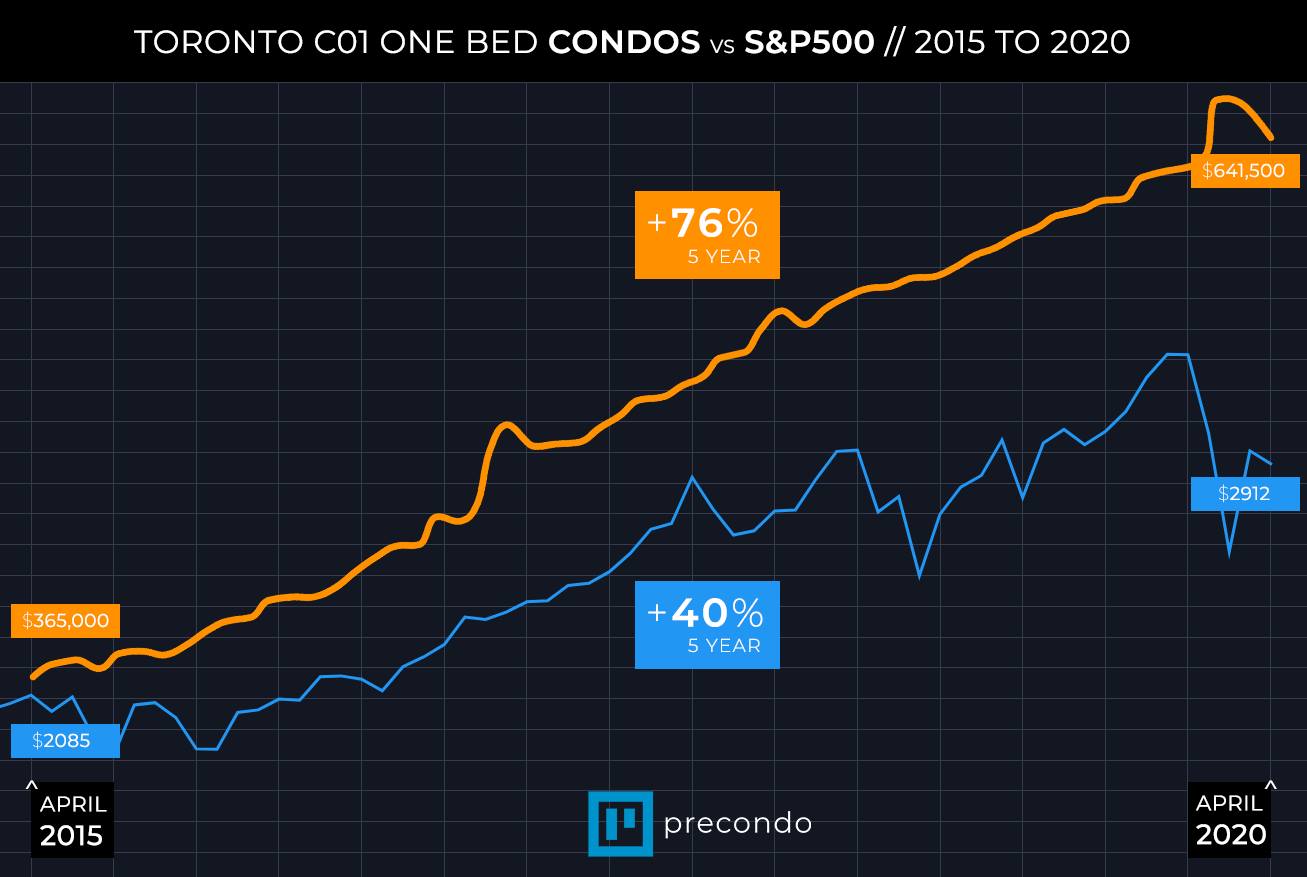
>Over the past 5 years the Toronto Housing market has held up better than the stock market
- When using the S&P500 as a benchmark for the stock market – Toronto Condos have outperformed both in gross return and resilience through Covid
- The housing market numbers used are April 2015 versus April 2020 (month close in the case of the S&P500)
- Even if you take the all-time-high of the S&P (in February) versus the 2020 low for Toronto Condos (in April), condos still managed to out-perform
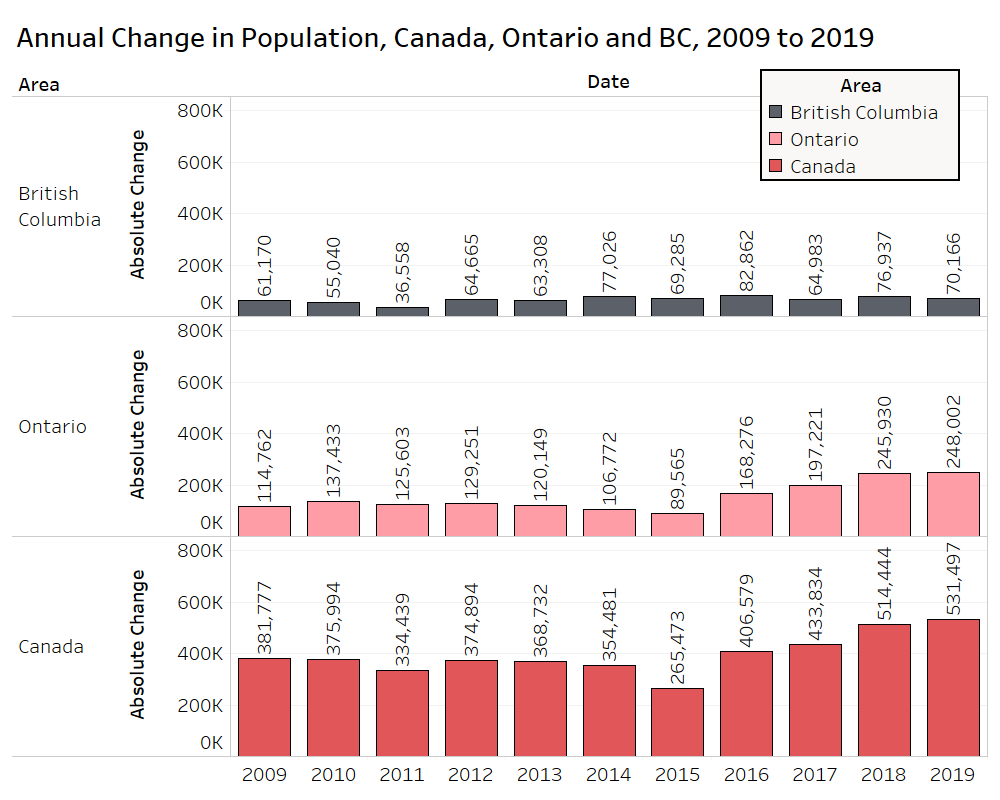
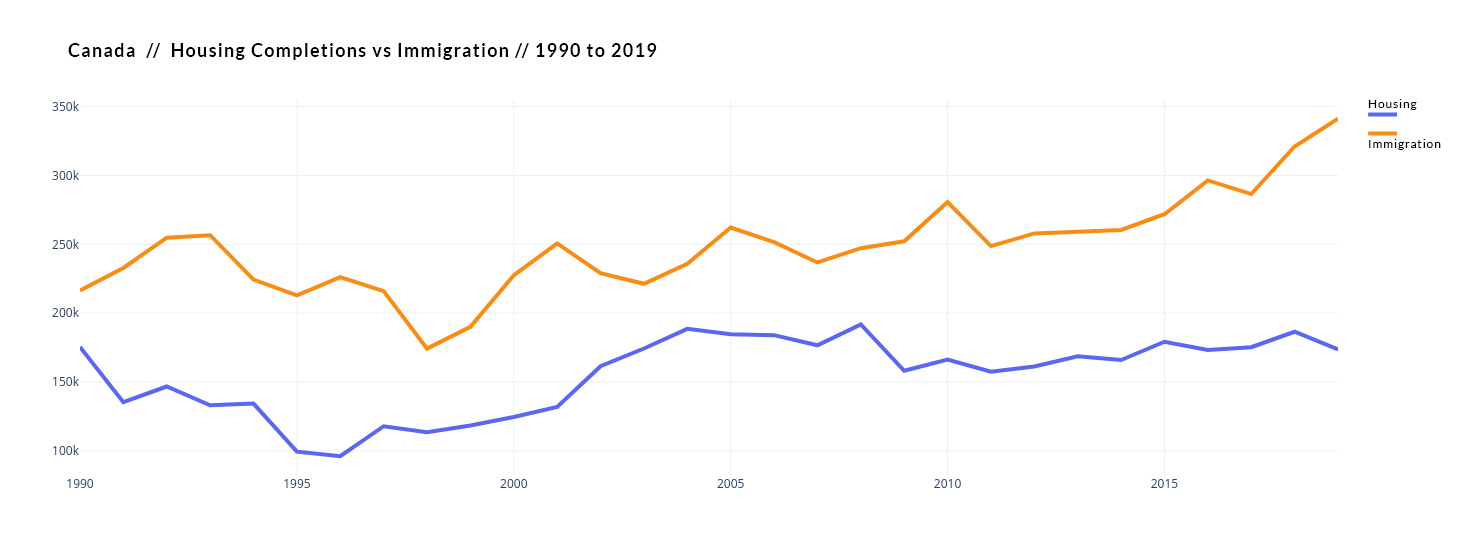
Despite housing construction at all-time highs, it’s not enough to meet demand
- In 2019, 148,663 new homes were completed across Canada. 82,273 were condos (55%), and 38,766 were single detached homes (26%), the rest were town-homes and semi-detached [⁵]
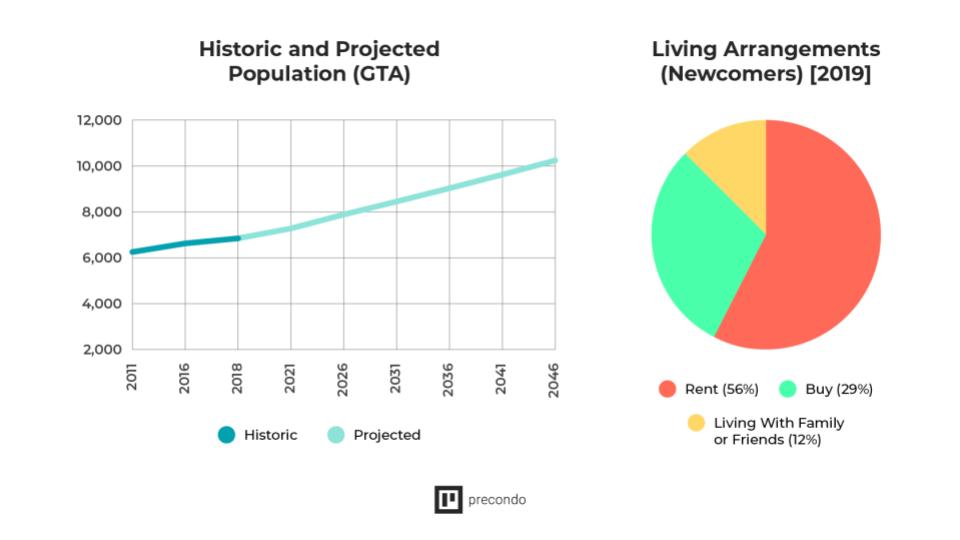
- Canada’s Population grew by an estimated 531,497 people from 2018 to 2019, making Canada the fastest-growing among the G7 countries [⁶]
- Ontario’s population grew by 248,000 in 2019. In the same year, 50,549 new homes were built in the province.
- Ontario’s population is projected to increase from 14.5 million (2019) to 19.8 million in 2046 (27 years) [⁷]
Source: Ben Myers, Bullpen Consulting
The Canadian Housing Market has averaged a 6.11% yearly appreciation over 15 years
- Canada Composite Housing (all markets and regions) benchmark price increased from $260,500 in February 2005 to $634,300 in February 2020. This represents a 143.5% total 15-year appreciation or 6.11% per annum compounding. [⁸]
- If you invested $52,000 on a $260,000 property in Canada in 2005, that property would now be worth $634,000 on average
- This would translate to a $374,000 capital gain on a $52,000 investment over a 15-year hold (plus any mortgage principal paid down and positive cash flow from rental income)
- These numbers are based on the median benchmark price for all of Canada across all property types. Some regional markets and asset classes performed better, and others performed worse.
Foreign ownership represents a minor proportion of ownership
- British Columbia: Foreign ownership represents 3.8% of the market total, or 66,125 homes [⁹]
- Ontario: Foreign ownership represents 2.2% of the market total, or 107,340 [⁹]
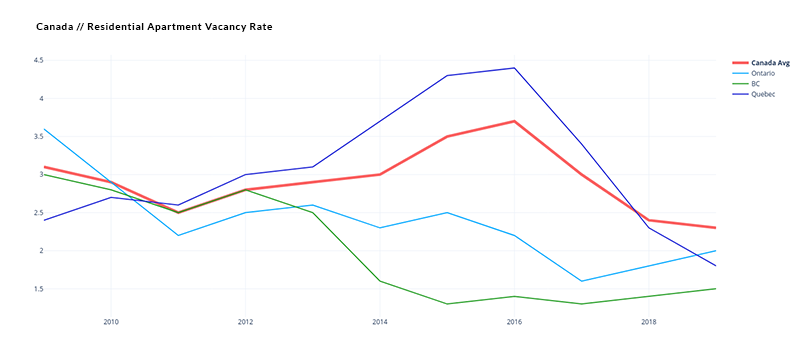
Vacancy rates are at all-time lows
- Residential apartment vacancy rates are at all-time lows in Canada, averaging 2.3%, down from 3.5% in 2015 [¹⁰]
- British Columbia has the lowest Vacancy rate in Canada at 1.5%
- Quebec has the second lowest Vacancy rate in Canada at 1.8%
- Ontario has the third lowest Vacancy rate in Canada at 2%
In 2019, Canadian Real Estate accounted for more than half of Canada’s GDP increase
- In 2019, more than half of Canada’s GDP gain was from Canadian Real Estate transactions [¹¹]
- In 2019, Canada issued $102 billion in residential and commercial real estate permits, from $99.8 billion in 2018 [¹²]
- This real estate market figure is a 22% increase in building permits from 2013 ($81B) to 2019 ($102B)
Market Performance: Appreciation
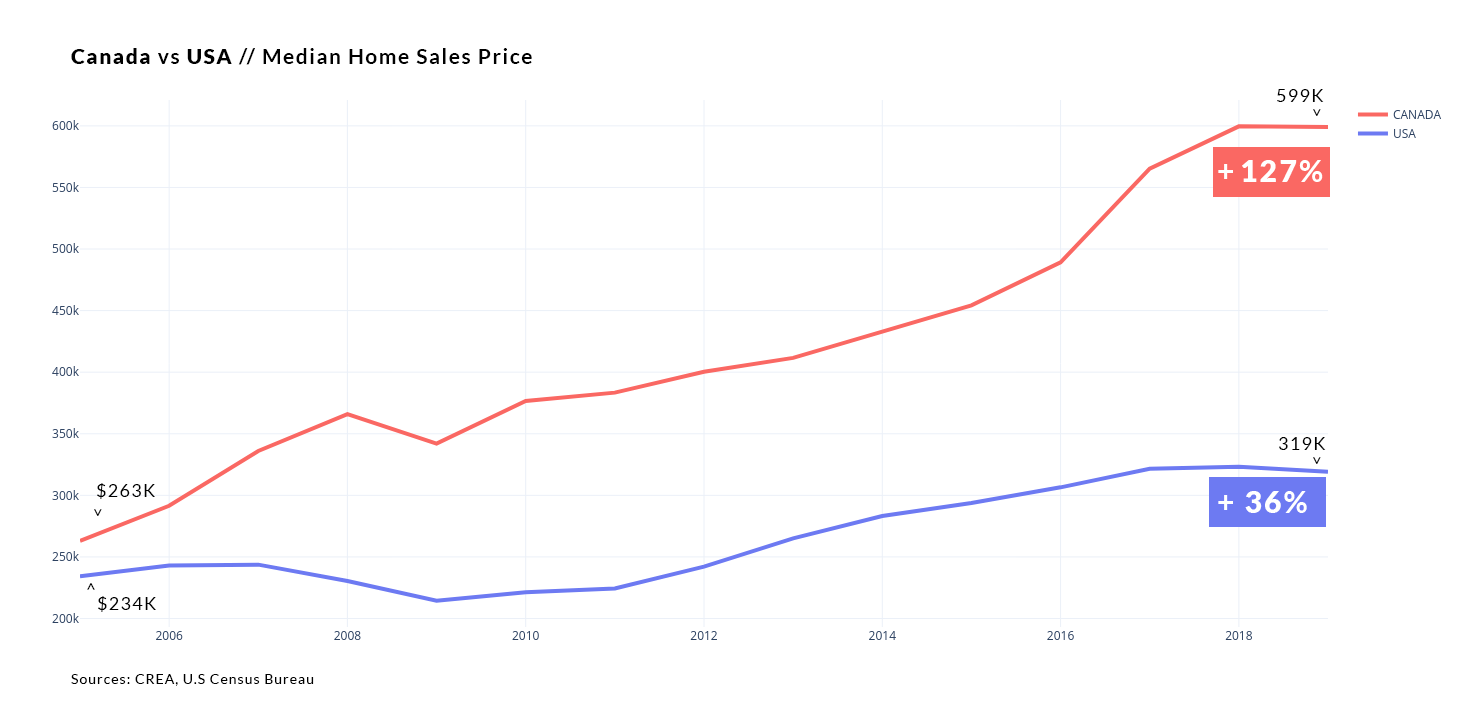
15-Year Market Performance
- Canada Composite (all markets and regions) benchmark price increased from $260,500 in February 2005 to $634,300 in February 2020. This represents a 143.5% total 15-year appreciation, or 6.11% per annum compounding [¹³]
- By comparison, the median home sales price in the US increased from $232,500 in 2005 to $324,500 in 2020 – representing a 39.6% increase in 15 years or 2.25% per annum (note: the US was hit considerably harder by the 2008 financial crisis) [¹⁴]
Regional Performance [¹⁵]
- Condos in the Greater Toronto Area benchmark: $199,800 in Feb 2005 to $578,400 in Feb 2020, representing a gross increase of 189% in 15 years, or 7.34% per annum
- Detached in the Greater Toronto Area benchmark: $343,800 in Feb 2005 to $938,500 in Feb 2020, representing a gross increase of 173% in 15 years, or 6.92% per annum
- Condos in Vancouver: $250,200 in Feb 2005 to $677,200 in Feb 2020, representing a gross increase of 171%, or 6.86% per annum
- Detached in Vancouver: $545,100 in Feb 2005 to $1,440,200 in Feb 2020, representing a gross increase of 164%, or 6.69% per annum
- Montreal composite (all dwelling types): $192,100 in Feb 2005 to $390,300 in Feb 2020, representing a gross increase of 103%, or 4.84% per annum
- Oakville – Milton composite: $379,900 in Feb 2005 to $1,077,200 in Feb 2020, representing a gross increase of 184%, or 7.20% per annum
- Hamilton – Burlington composite: $224,900 in Feb 2005 to $644,200 in Feb 2020, representing a gross increase of 186%, or 7.27% per annum
- Calgary composite: $220,500 in Feb 2005 to $410,800 in Feb 2020, representing a gross increase of 86% or 4.24% per annum
- Ottawa region composite: $226,200 in Feb 2005 to $463,100 in Feb 2020, representing a gross increase of 105% or 4.89% per annum
- Niagara region composite: $172,000 in Feb 2005 to $438,700 in Feb 2020, representing a gross increase of 155%, or 6.44% per annum
- Barrie composite: $210,400 in Feb 2005 to $490,500 in Feb 2020, representing a gross increase of 133%, or 5.81% per annum
Real Estate & Immigration
- New immigrants purchase one in Five homes [¹⁶]
- Canadian newcomers projected to purchase 136,000 homes per year over the next 5 years
- 82% of newcomers choose to remain in their first city of residence
- 75% of newcomers arrive with savings intended to help purchase a home
- 75% of newcomers do not consider moving to the USA before Canada. The primary reason cited is newcomers feel more welcomed as immigrants in Canada
- International migration accounts for 80% of Canada’s population growth
- 86% of new Canadian immigrants view Real Estate as a good investment due to the increasing home prices
- On average, the newcomers who purchase Real Estate in Canada make their first purchase within 3 years of arriving
- British Columbia: Newcomers projected to purchase 91,000 homes over the next 5 years, setting the bar for the new housing price index
- Alberta: Newcomers projected to purchase 76,000 homes over the next 5 years
- Prairies: Newcomers projected to purchase 71,000 homes over the next 5 years
- Atlantic Canada: Newcomers projected to purchase 43,000 homes over the next 5 years
Regional Immigration to Ontario
- 46% of all international migration goes to Ontario, increasing the home price index
- The Homeownership rate for new immigrants in the GTA and Ottawa is 32%
- New immigrants in Ontario account for 21% of all home buyers in the province
- In Ontario, new immigrants are projected to purchase 286,000 homes over the next 5 years (at current immigration rates)
- 88% of new immigrants to Ontario believe home-ownership is a good investment
- 82% of new immigrants to Ontario arrive with savings to help purchase a home
Regional Immigration to Quebec
- 19% of international immigration to Canada goes to Quebec, contributing to the increased home prices
- New immigrants represent 19% of all home purchases in Quebec
- New immigrants in Quebec are projected to purchase 102,000 homes in the next five years (at current immigration rates)
- Quebec has the lowest home-ownership rate in the Country for new immigrants at 25%
- 67% of newcomers to Quebec arrive with savings to help with purchasing a home
All stats provided are sourced from Real Estate Boards (e.g. CREA, TREB), CMHC, and Statcan directly. They are not Precondo’s stats and we make no claims about their accuracy.
Did you enjoy this article? See Precondo’s homepage for more information on properties for sale, rent and pre-construction properties.
References
1. https://www150.statcan.gc.ca/t1/tbl1/en/tv.action?pid=1110001601&pickMembers%5B0%5D=1.1&pickMembers%5B1%5D=3.1&pickMembers%5B2%5D=5.5&pickMembers%5B3%5D=4.2
2. https://www.marketwatch.com/story/whats-your-net-worth-and-how-do-you-compare-to-others-2018-09-24