
It’s that time of the year for a quick market recap – Toronto condos, the broader market, where we’ve been & where I think we may be going.
Quick disclaimer: I don’t like to make predictions – the very nature of predictions is something I try to avoid. All I’m presenting here; the stats over the last year or so & my take on them.
The story of the market over the past year; fragmented. Suburbs are on an absolute meteoric price rise while condos, specifically downtown condos, are not. This, in my view, presents some interesting opportunity, which we’ll get into below.
If you prefer to watch the market update recap in video format, it’s below
Months of Inventory
First things first, let’s talk about inventory – nobody is selling. Inventory is thin across all housing classes.
Detached is particularly shallow with 1 month of inventory in Toronto (the 416 proper) currently, while condos are slightly elevated at 1.4.
If you’re new here: MOI or Months of Inventory is just supply and demand distilled into one indicator
It is the current active inventory divided by the monthly sales – so, if you have 1000 listings and 500 sell in a month, you have 2 months of inventory
Great way to check the market heat quickly and often the MOI trend is a leading indicator of where the price is headed in the short term
For reference: 0 to 3 months of inventory is a seller’s market, and 3 to 6 MOI is a balanced market
Below is the chart for months of inventory in Toronto for condos and detached over the last few years
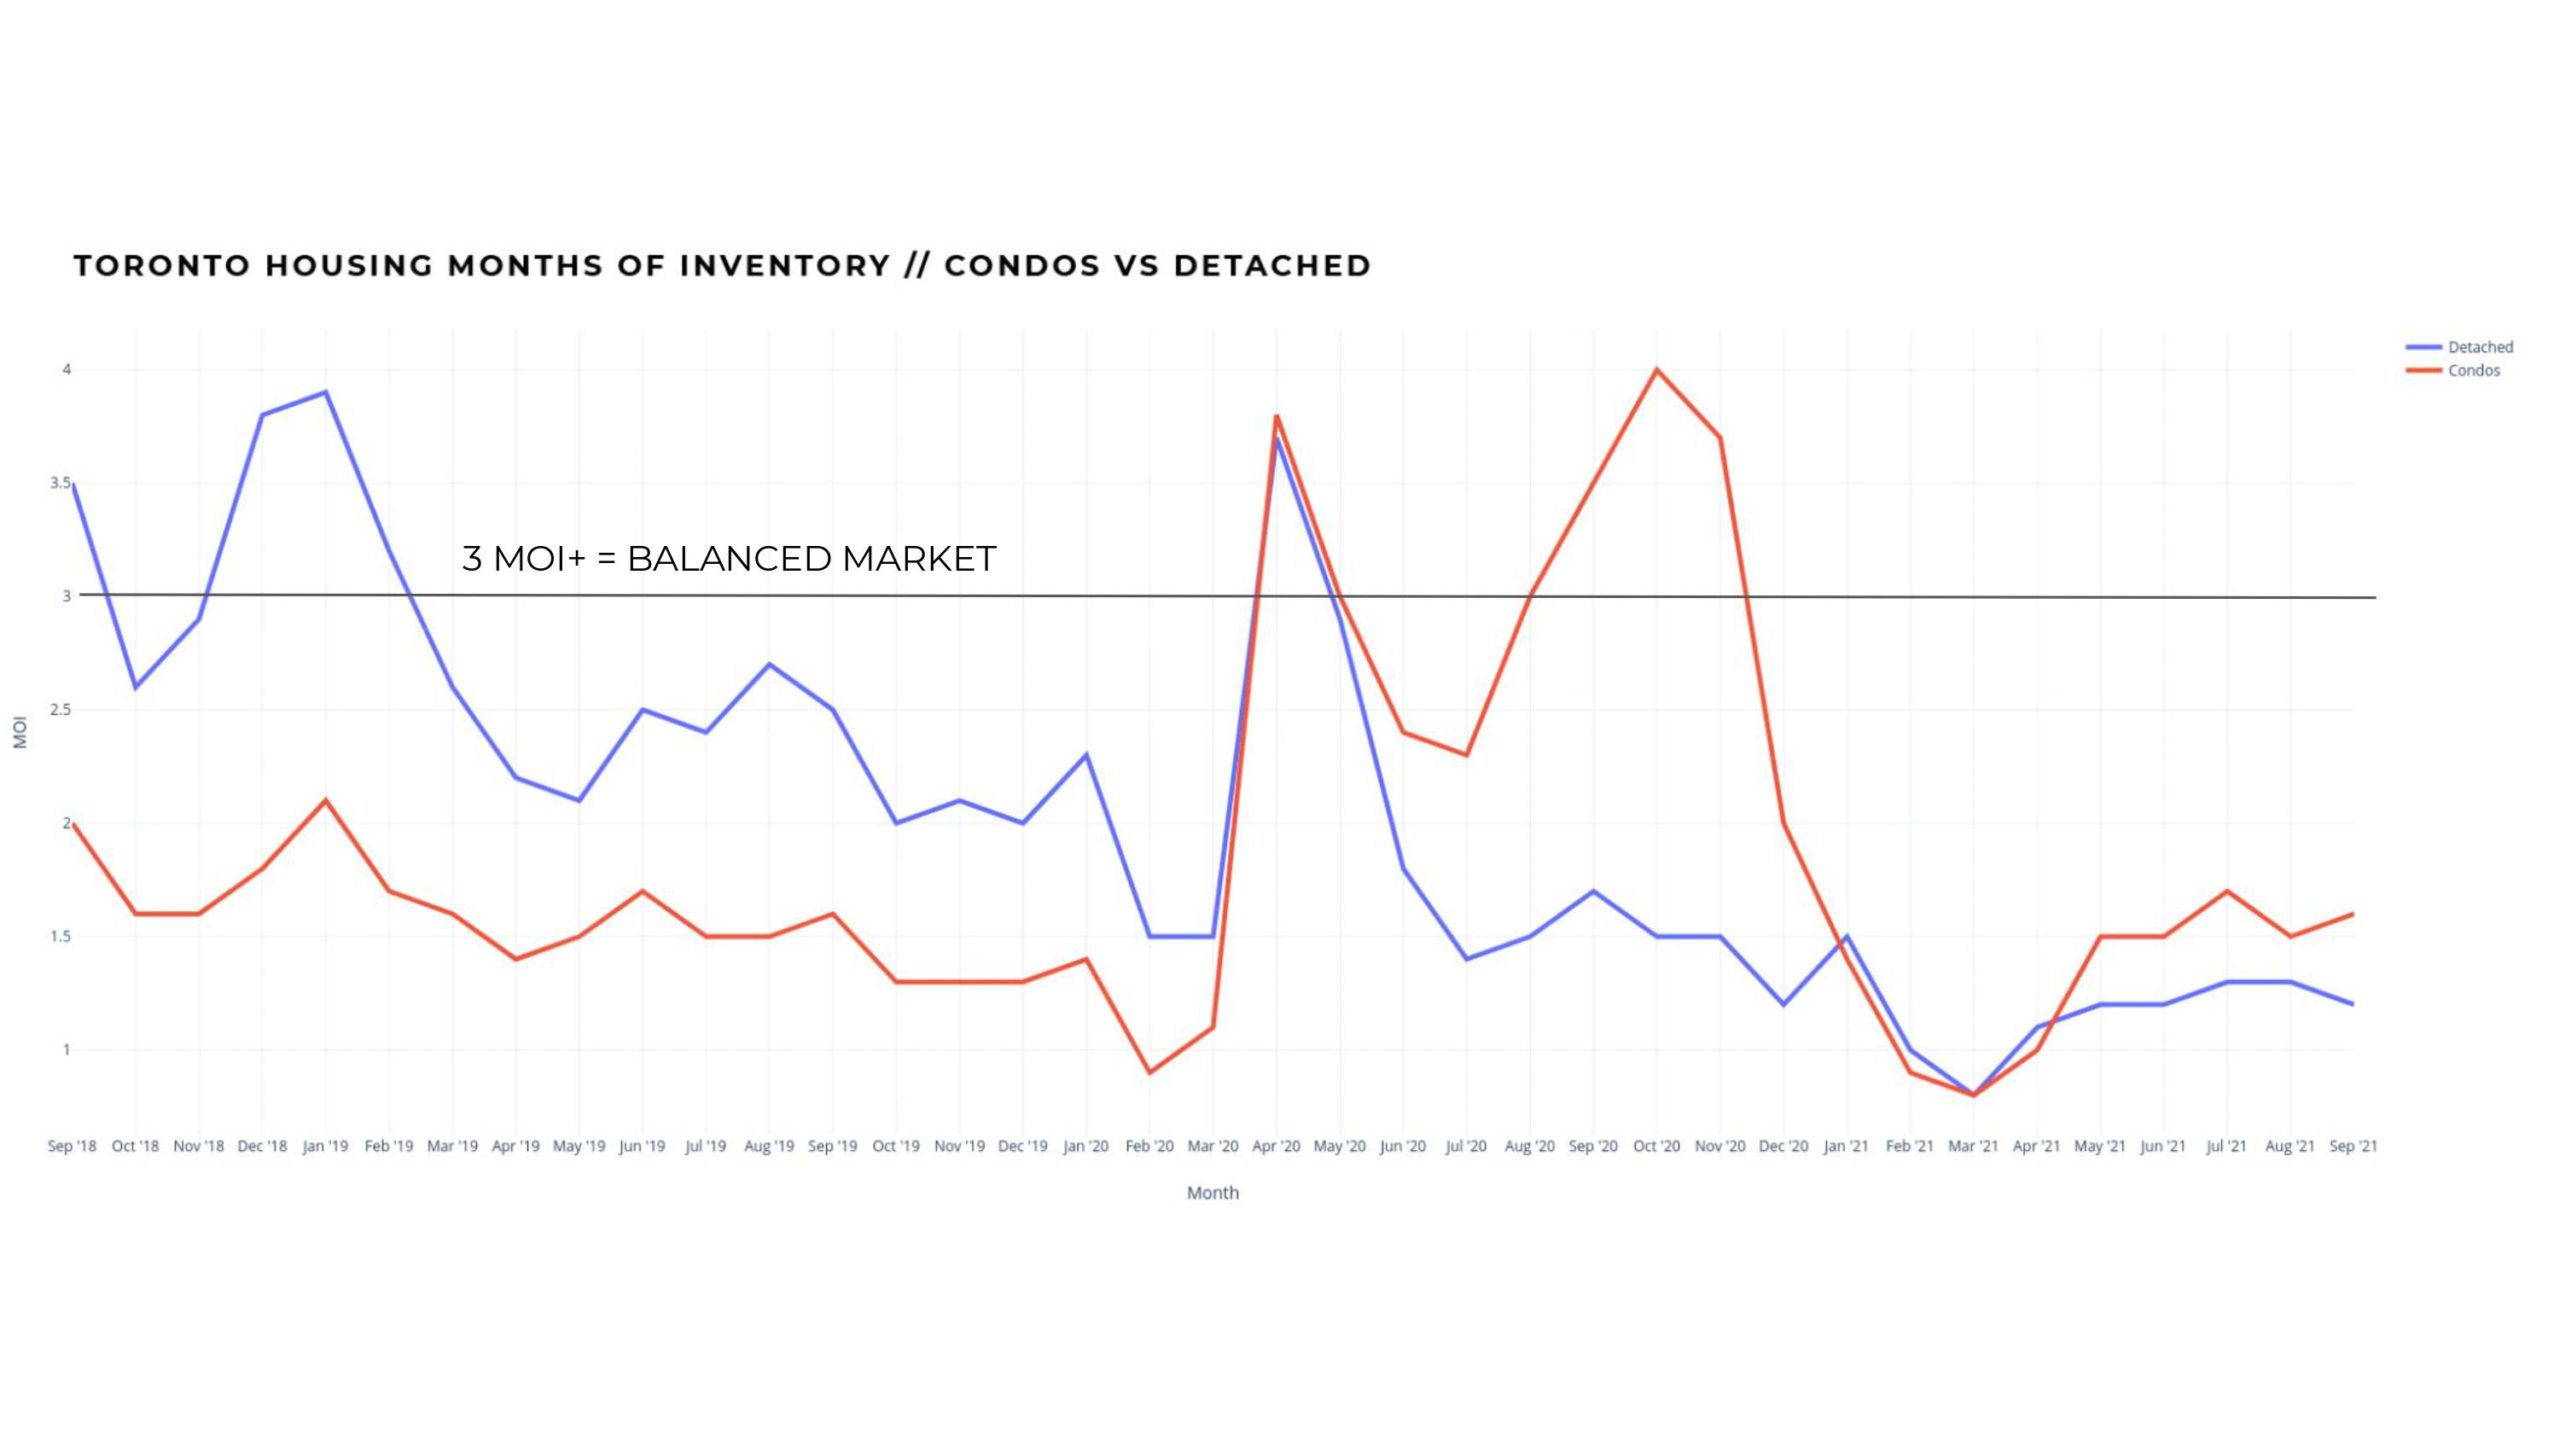
You’ll notice that when COVID first hit, we saw MOI spike briefly for both condos and detached as the market froze up in a little healthy fear. Everyone put a pause on their buying plans
Subsequently, MOI for detached dove while MOI for condos stayed elevated as people were seeking more space for less $
This is why we saw Detached prices run while condo prices dipped and/or traded sideways for some time
Average Price Gap In the GTA
This leads us into our next chart here
This chart represents the price/dollar gap in the average selling price of a detached home versus the average selling price of a condo in Toronto
Important to note here, that at a $1M gap in pricing between the two, we’re elevated to the second-highest price gap ever on record, rivaling only the 2016/17 detached housing mania
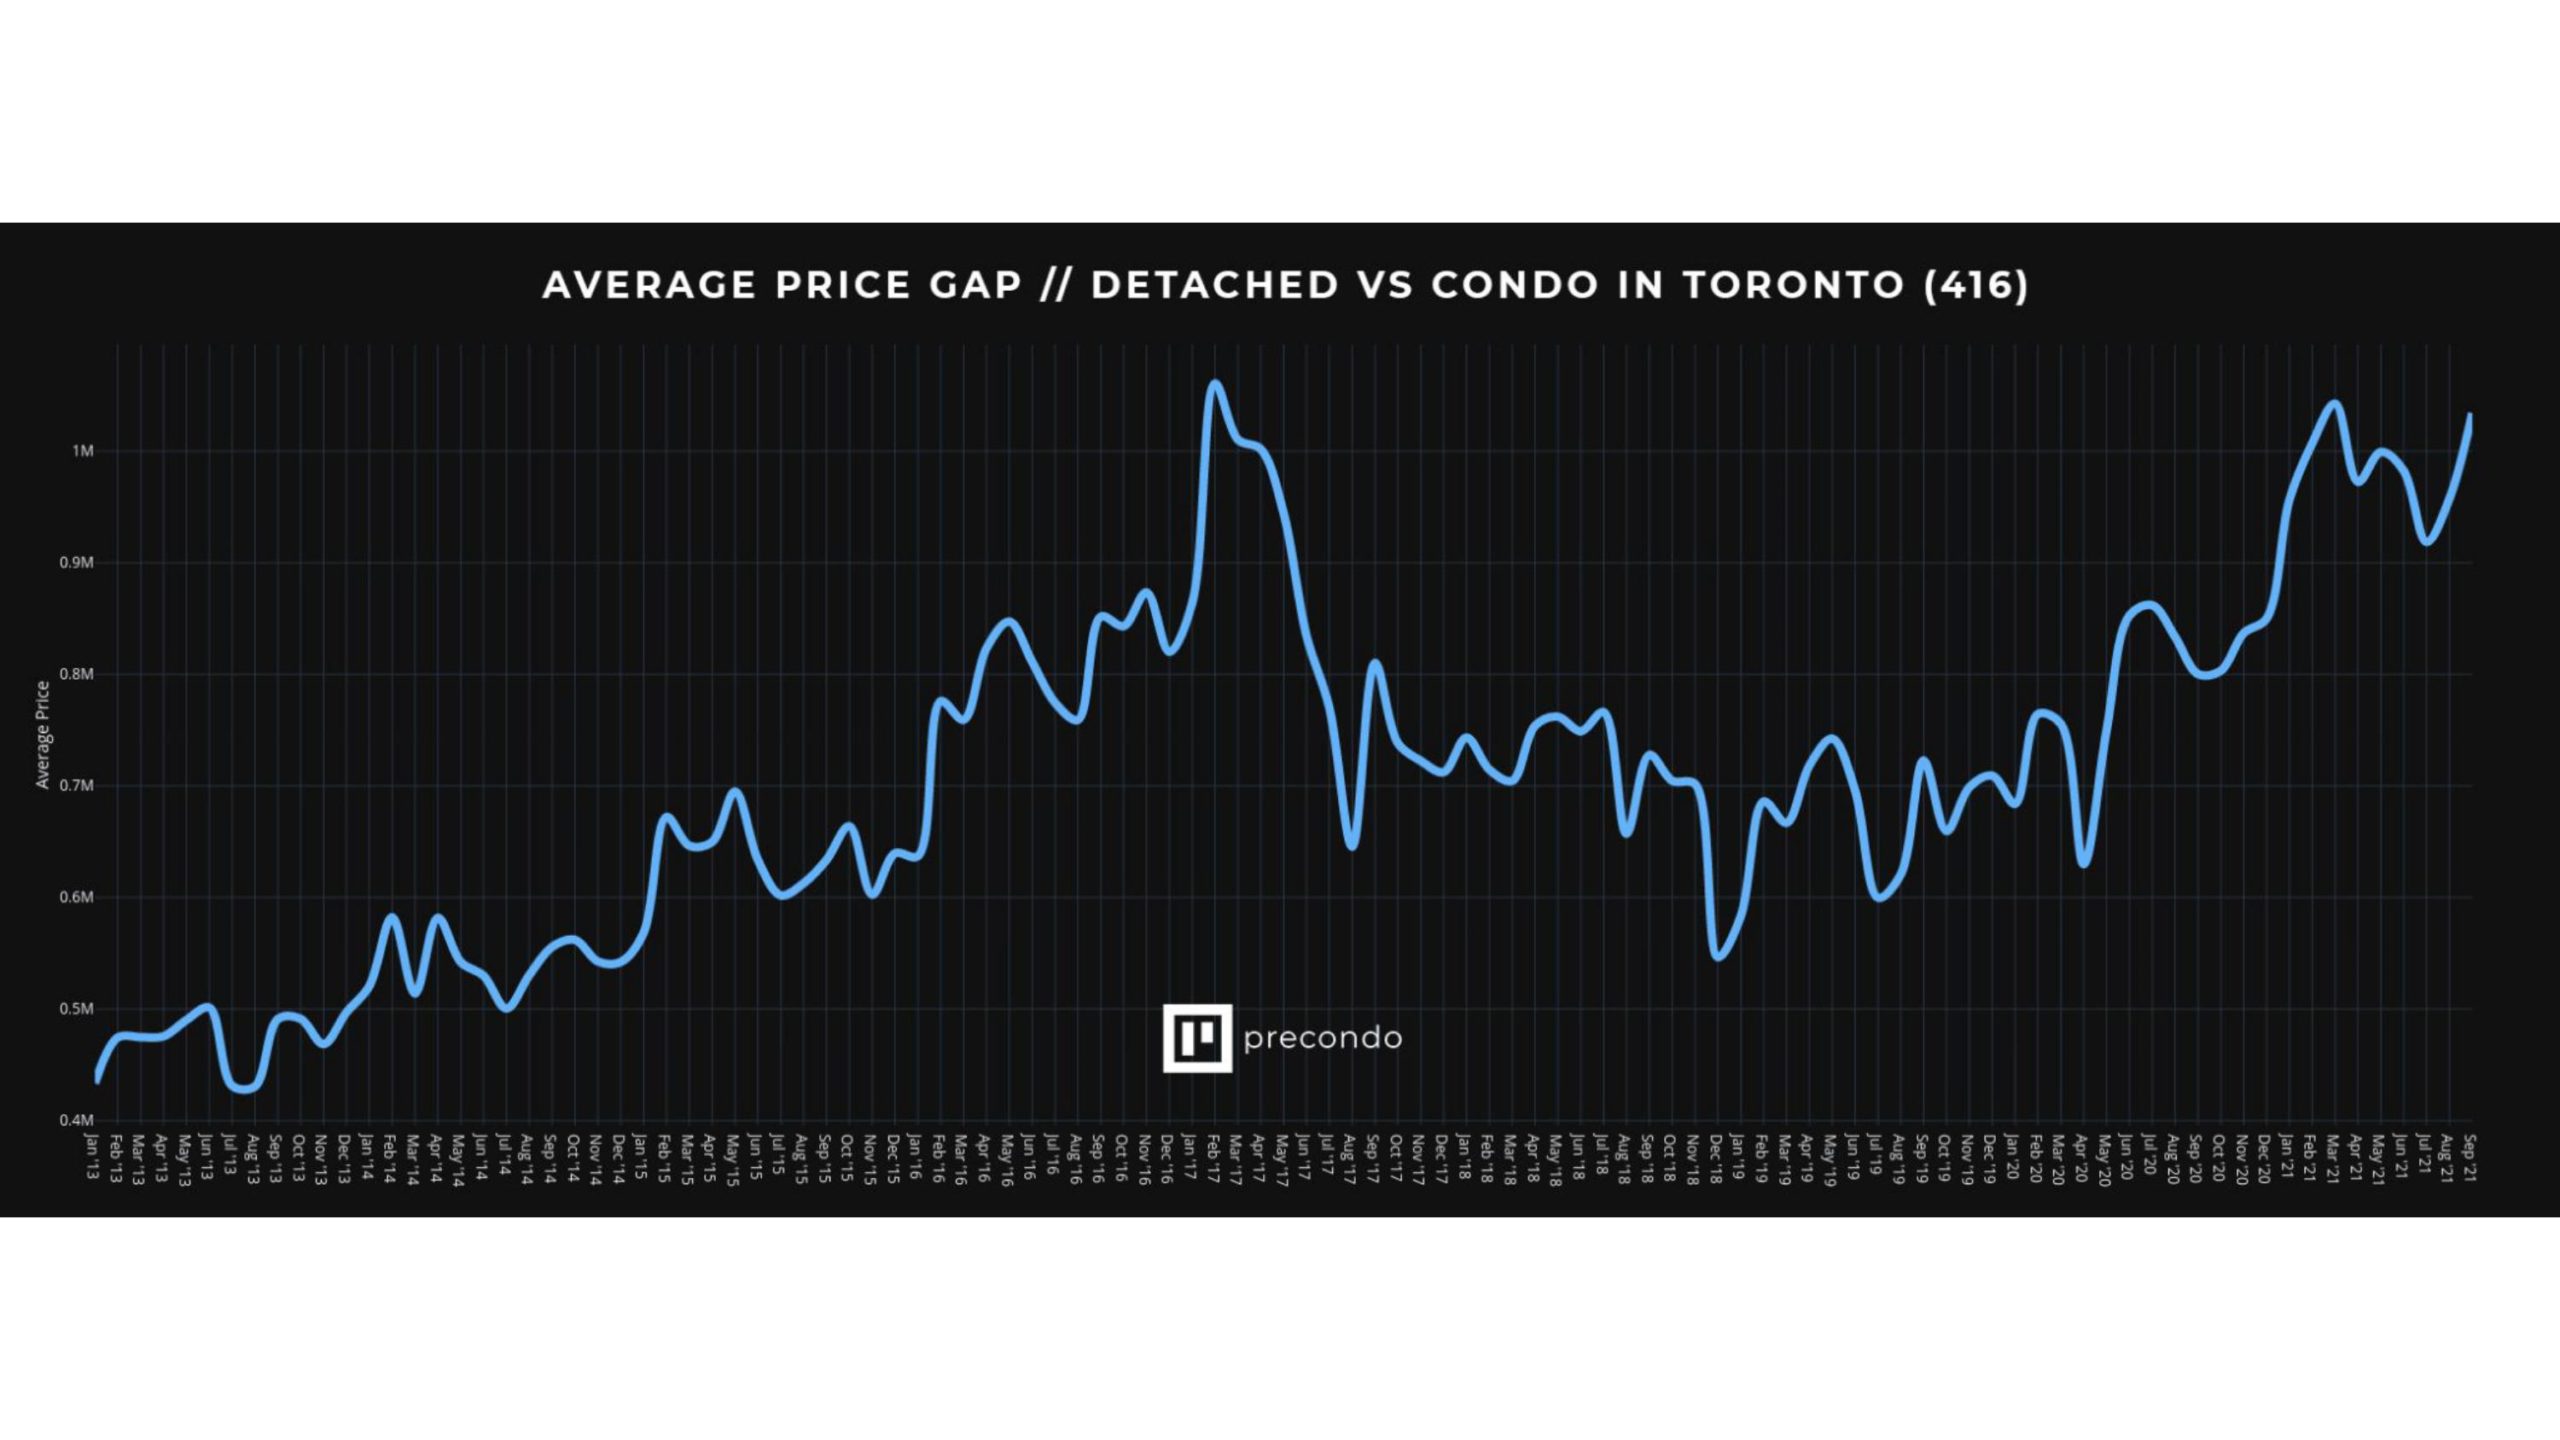
This, to me, means condos are severely undervalued right now due to the exogenous force of covid
As things being to normalize, I can only anticipate one of two things (or a combination of the two)
- Detached corrects downwards to close the gap to more historically normal levels
- Condos correct upwards to narrow gap (more likely in my view)
- A combo of the two simultaneously (as previously seen circa ’16-17)
This type of market dislocation is not specific to Toronto condos versus detached either
We’re also seeing outside suburb areas appreciate more rapidly than Toronto detached
Take, for example, Whitby. Up over 40% in the last year and a half, similar to Hamilton, Barrie, and other areas +/- 1 hour outside of Toronto
The chart below represents the average selling price of a detached home in Whitby vs. the avg selling price of a detached in Mimico/Alderwood (south Etobicoke, south of the Gardiner)
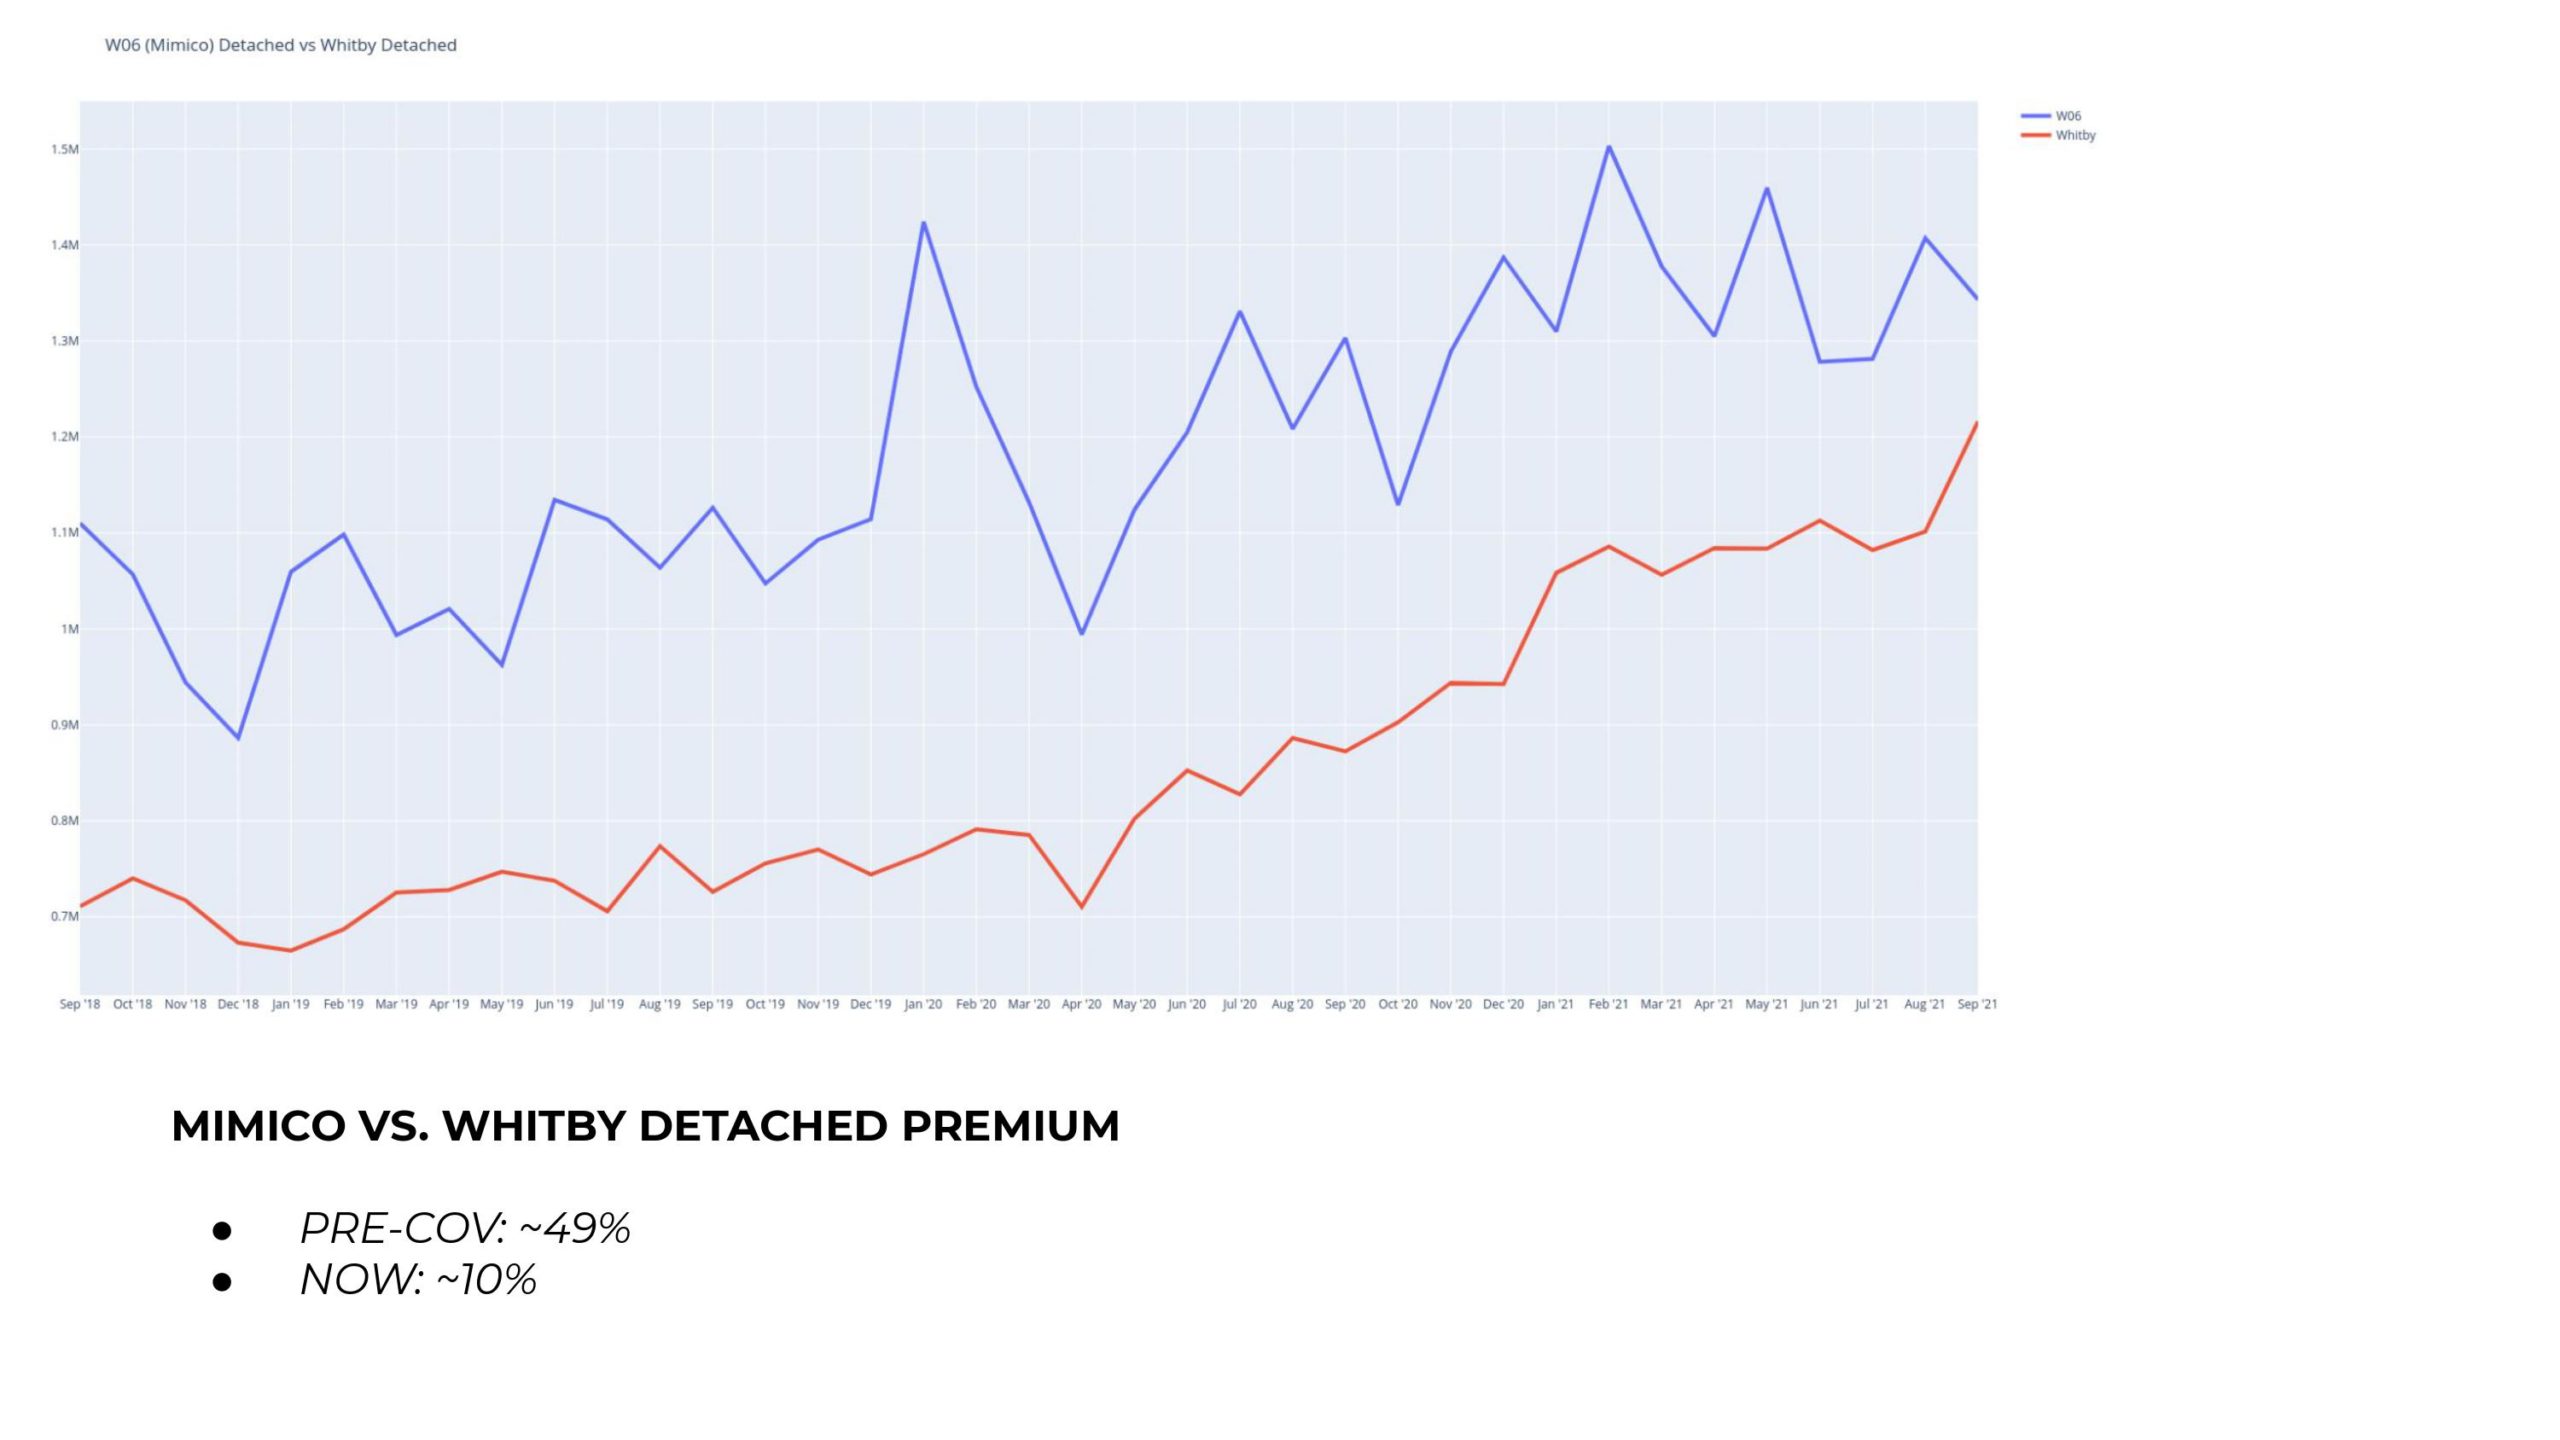
Once again, market dislocation is in plain sight in my view
There is an argument to be made that Whitby was undervalued pre-covid
An equally reasonable argument is that as Mimico/Alderwood was already north of $1M pre-covid, it’s easier to see capital flow into cheaper markets and push prices up in areas like Whitby
That said, I think a ~49% pre-cov premium in Mimico versus only 10% today is an indicator painting a beautiful picture for a correction
Again, in my view, Mimico runs to close the gap – this is probably more likely than Whitby correcting downwards, but time will tell
An even more interesting chart, but not entirely a fair comparison, is C01 (Downtown Toronto) condo price versus Whitby detached, see below
NOTE: Not picking on Whitby here! The charts look very similar for all outskirts markets. Hamilton, Barrie, Guelph, you name it.
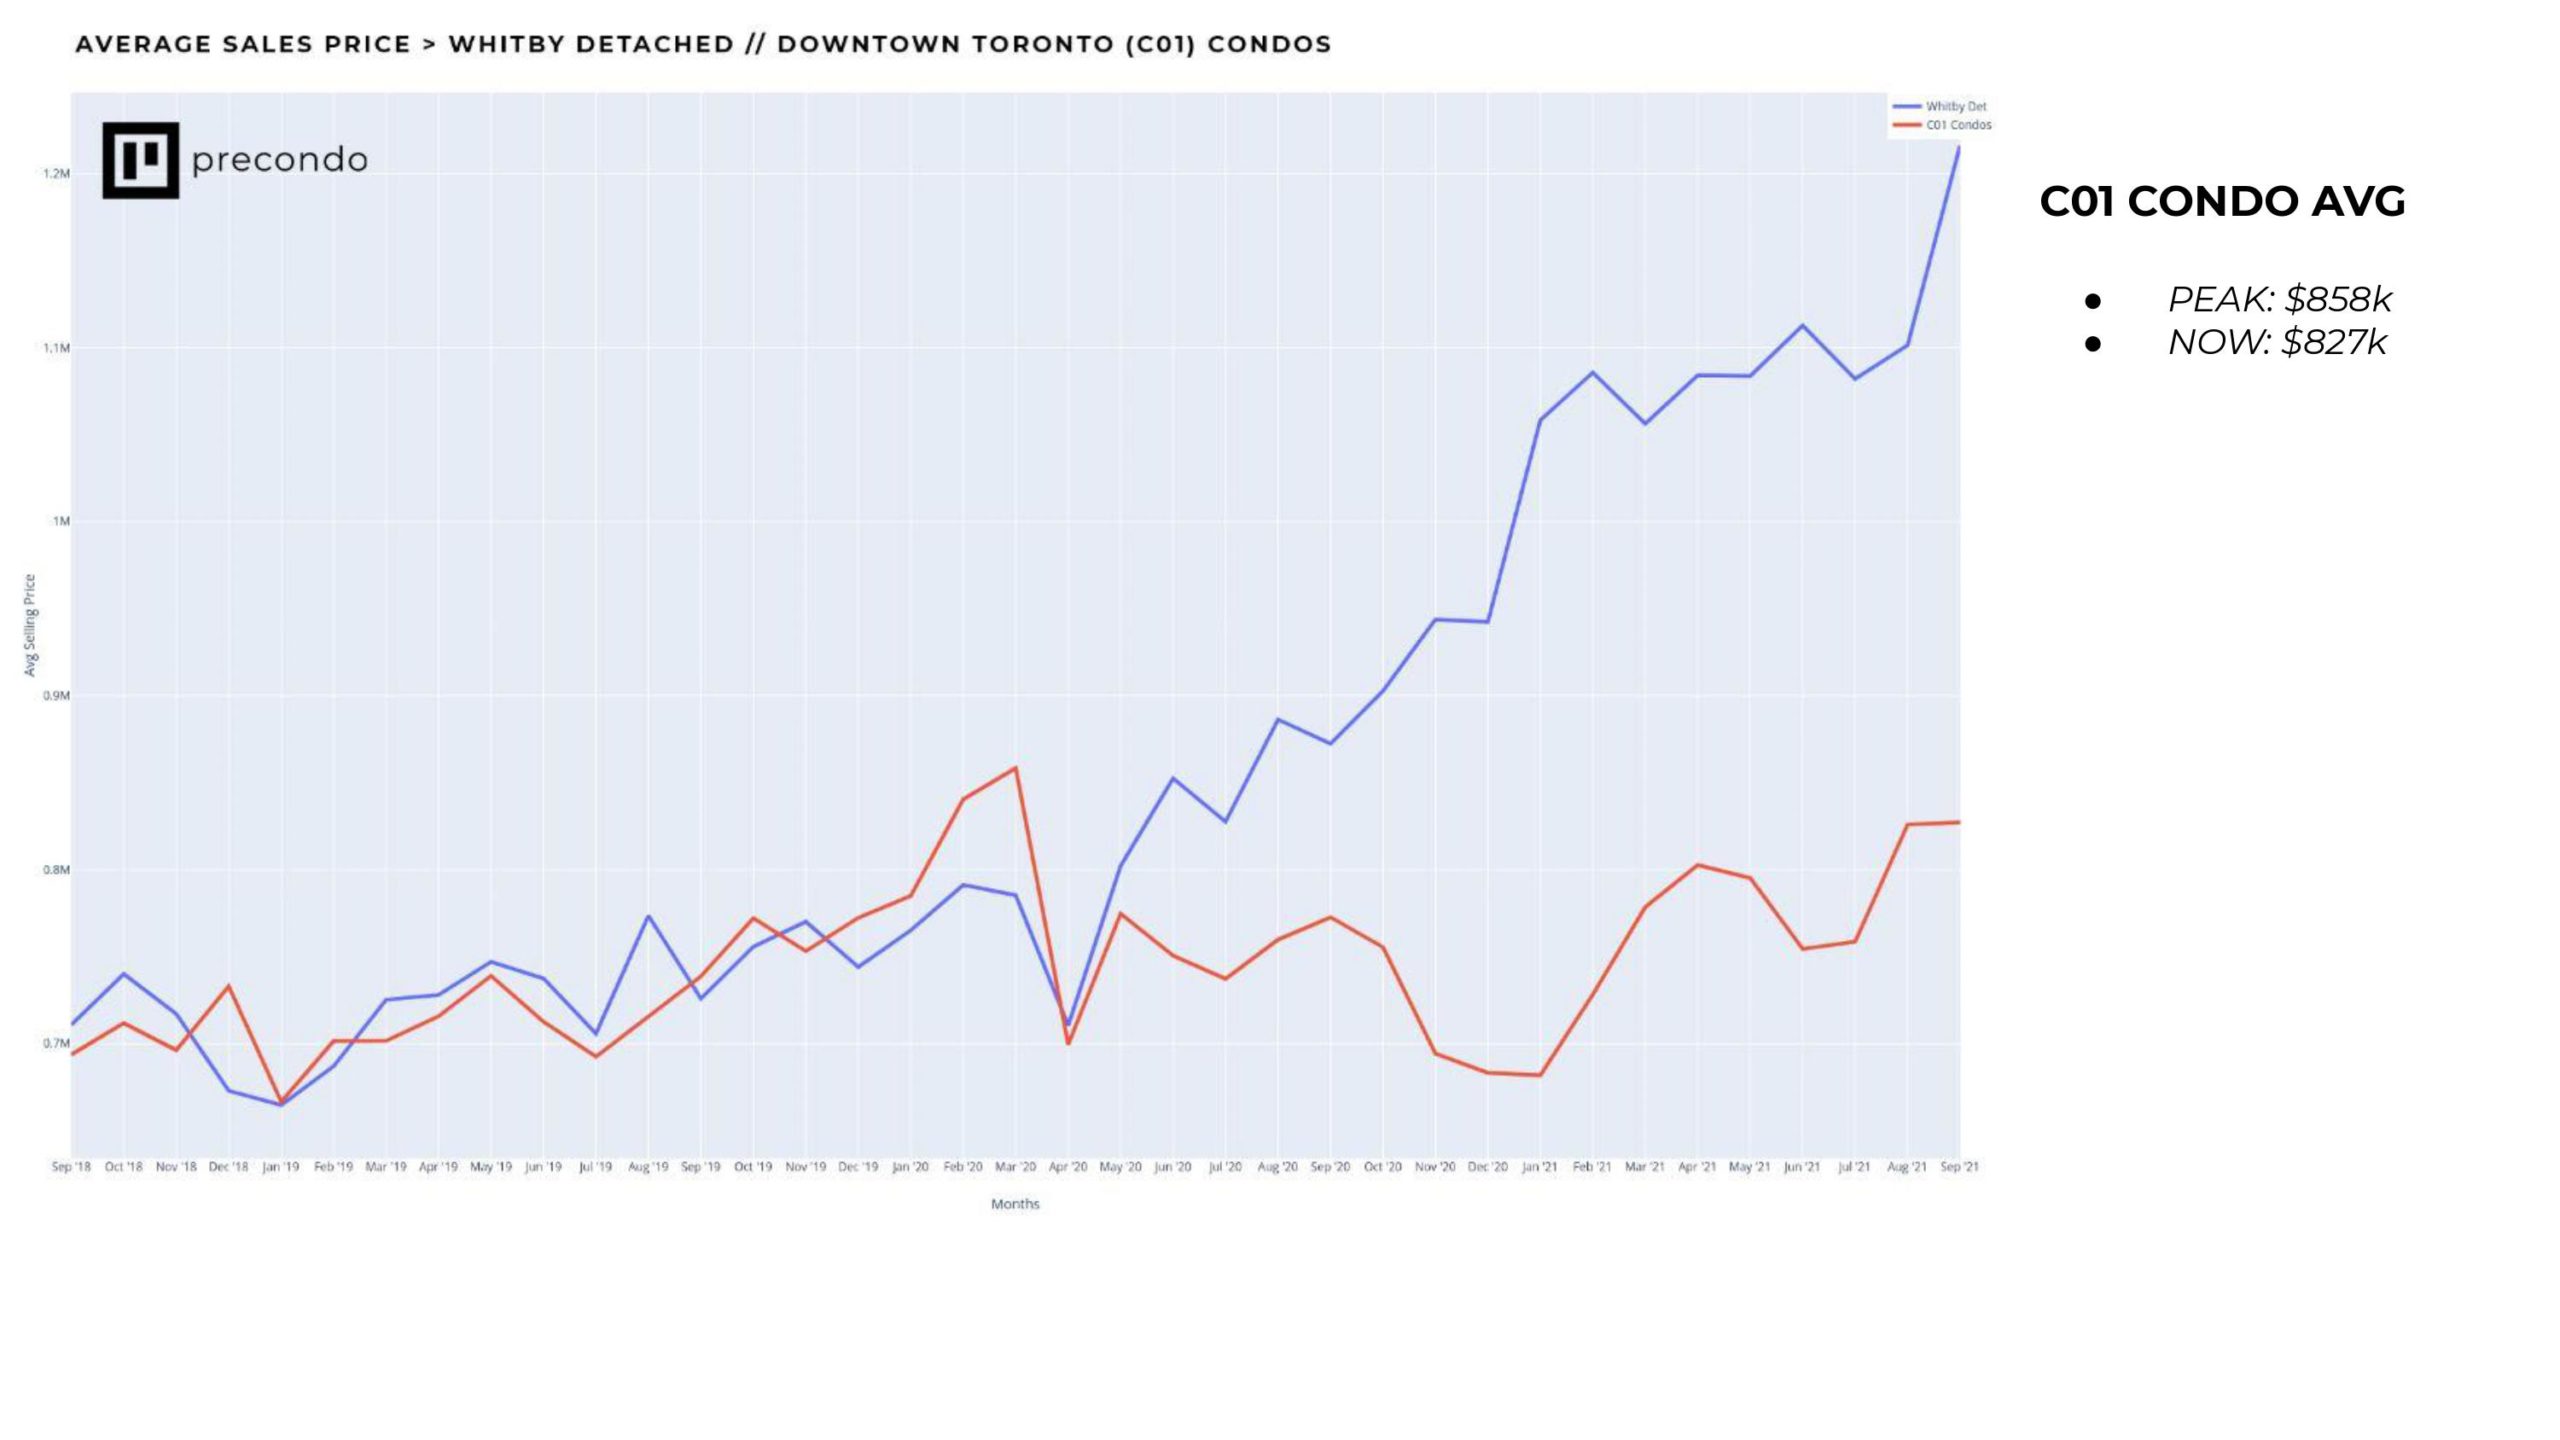
Pre-Cov, a detached in Whitby cost roughly the same as a condo in the Downtown Toronto core (roughly)
Covid comes along, changes buyer trends, and we see Whitby detached run while downtown condos dip and start to slowly recover
Nowadays, you’re looking at roughly a $400K premium for the detached in Whitby versus the downtown condo
Crazy, right?!
The condo market in Toronto itself is heavily fragmented in the same way
Some neighbourhoods, even some buildings appreciating rapidly while others are just.. not
We’re seeing a premium on certain buildings, and a premium on areas with access to lots of green space
An example of that is illustrated below for the avg price of a condo in Humber Bay versus the avg price of a condo in the Downtown Core
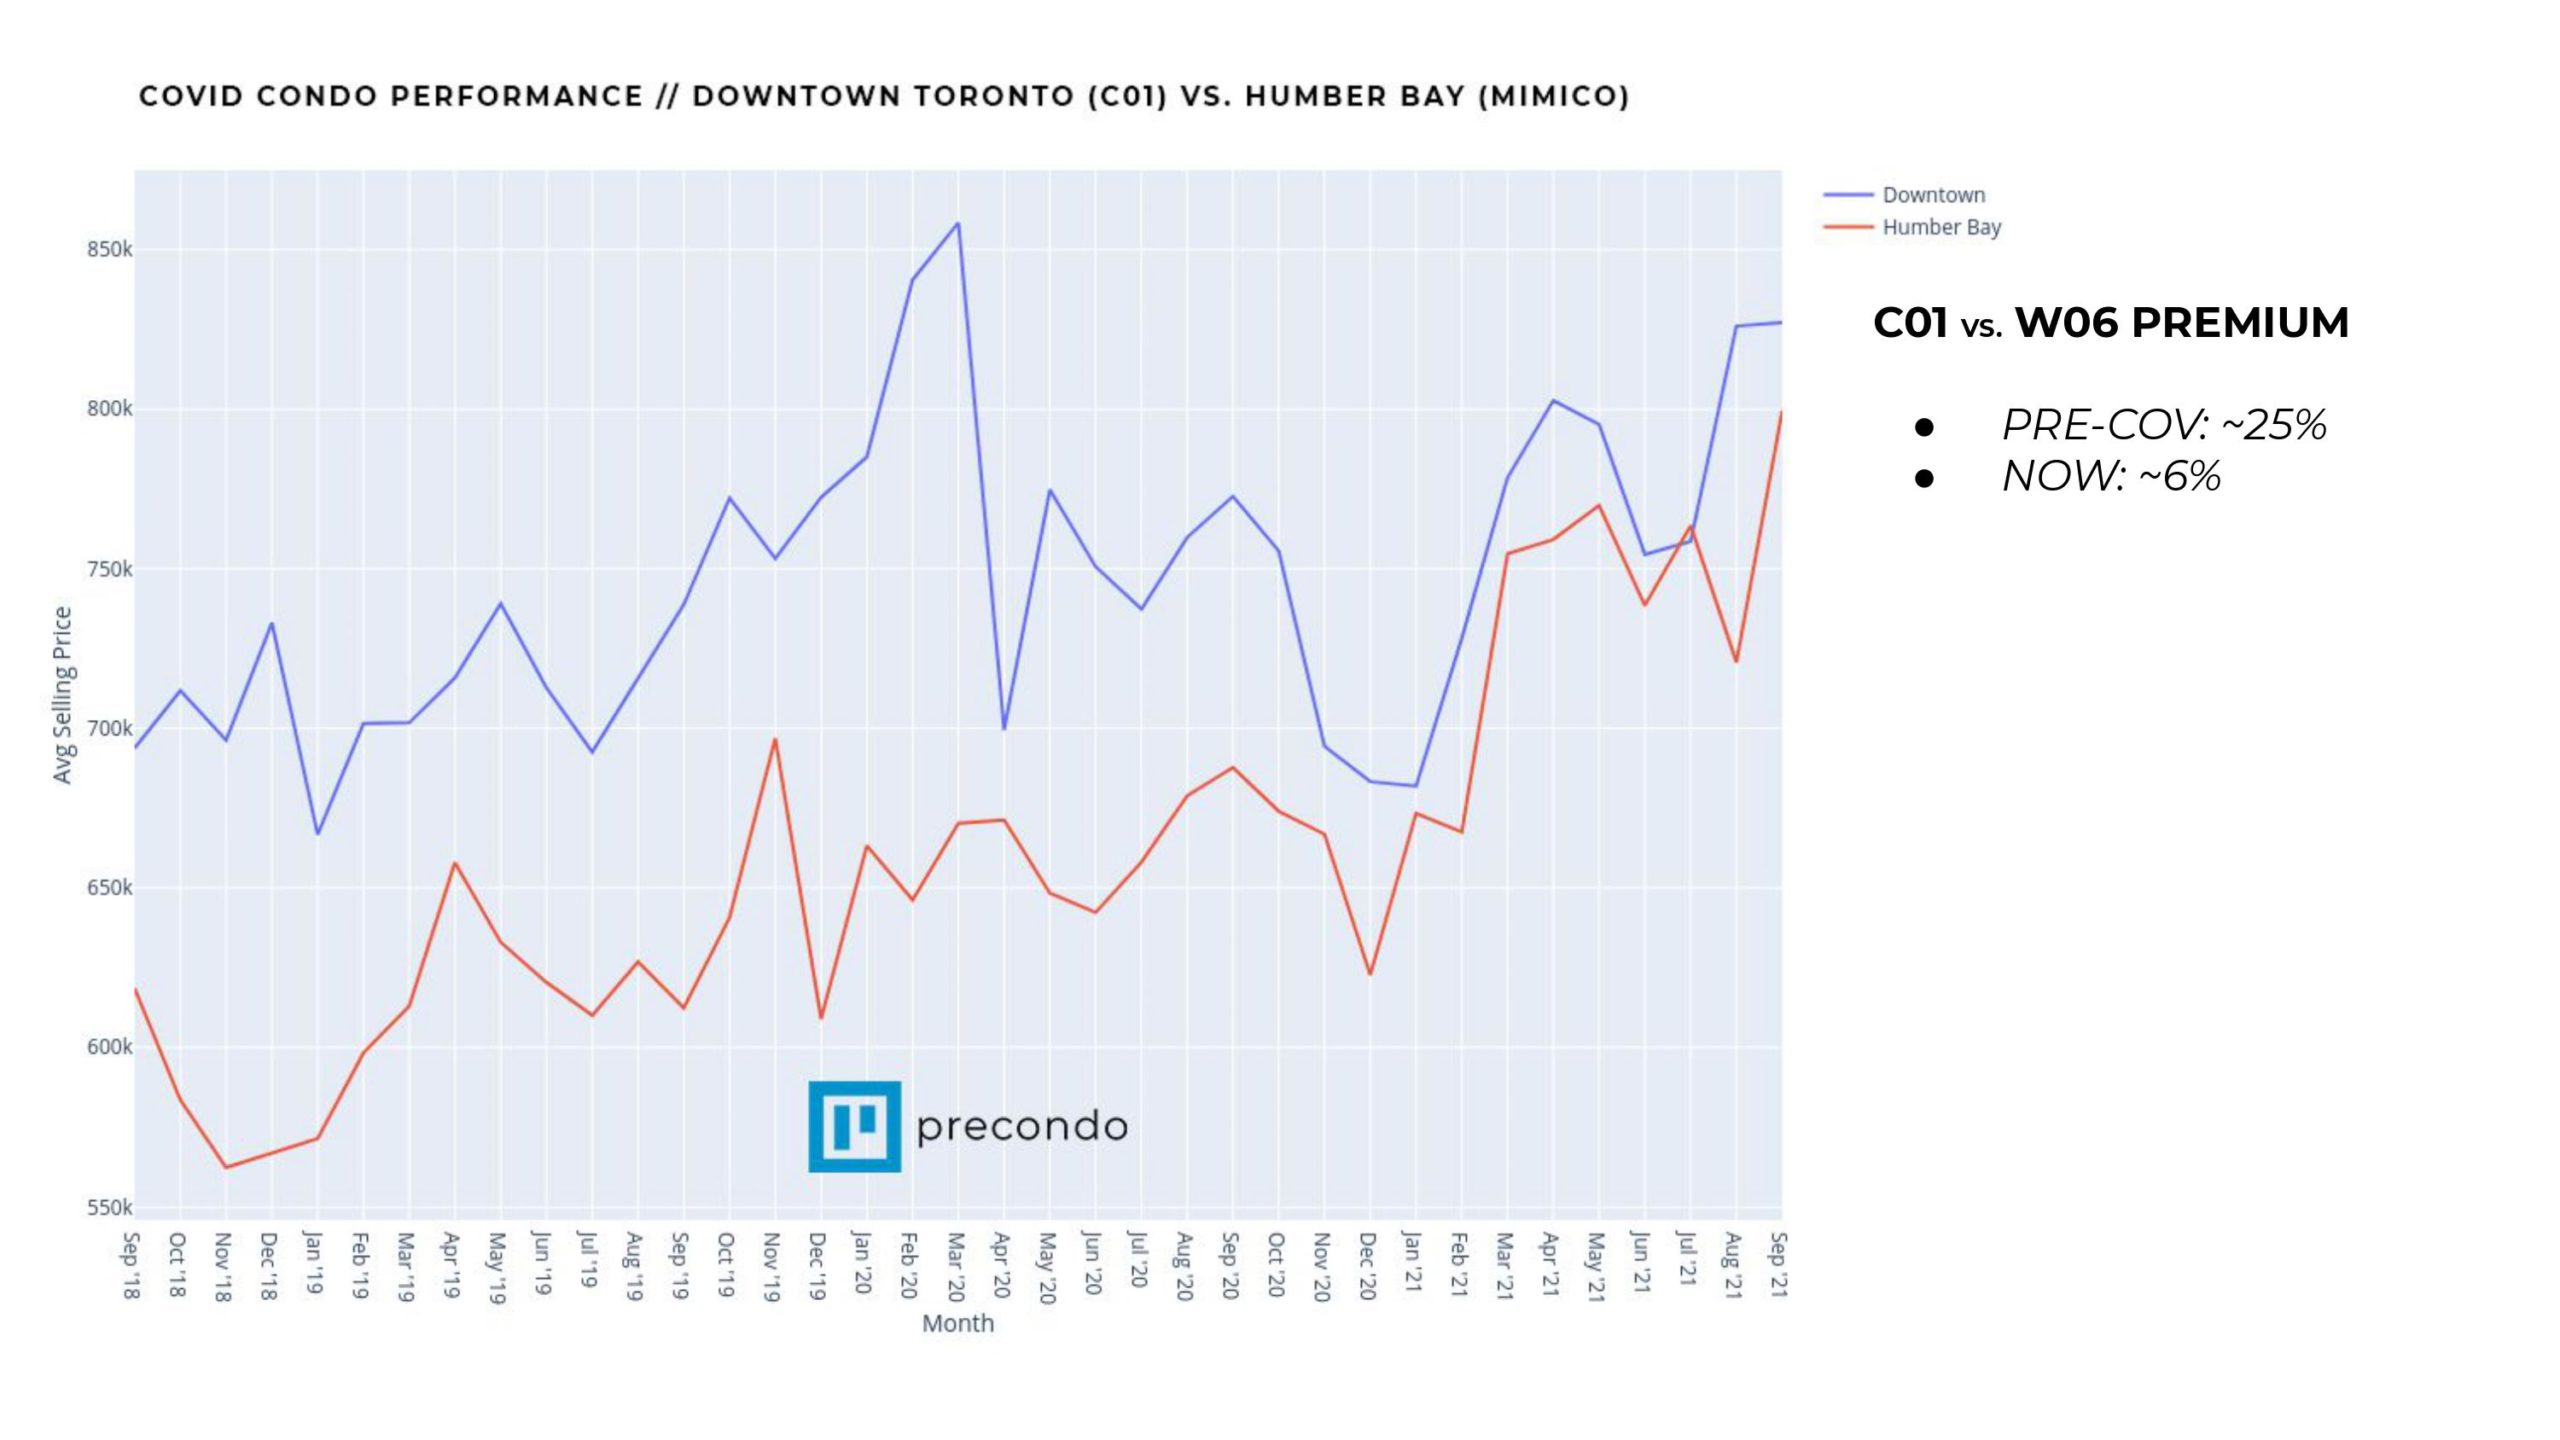
Prior to the pandemic, you’d be looking at about a 25% premium to buy a condo downtown versus Humber bay
Now you’re looking at a 6% premium
Newer 1 bedroom units at buildings like Eau Du Soleil for example are trading as high as $1300 per square foot these days
There’s few buildings downtown you can’t buy in at $1300PSF
To me, this just further illustrates the market dislocation as a result of changing trends from the pandemic. Huge premium on condos near parkland in this case.
Don’t get me wrong, Humber Bay is a beautiful place to live – but, I think over time, we’ll see a return closer to the normal premium for C01 vs W06
You’ve probably noticed by now with the charts showing the Downtown Toronto condo price – it technically hasn’t recovered yet
The average price is still down a little bit from the pre-pandemic peak
Examples of Unit Comparables
While the average shows that, looking at most building and unit comparables don’t show the same story, here’s an example below:
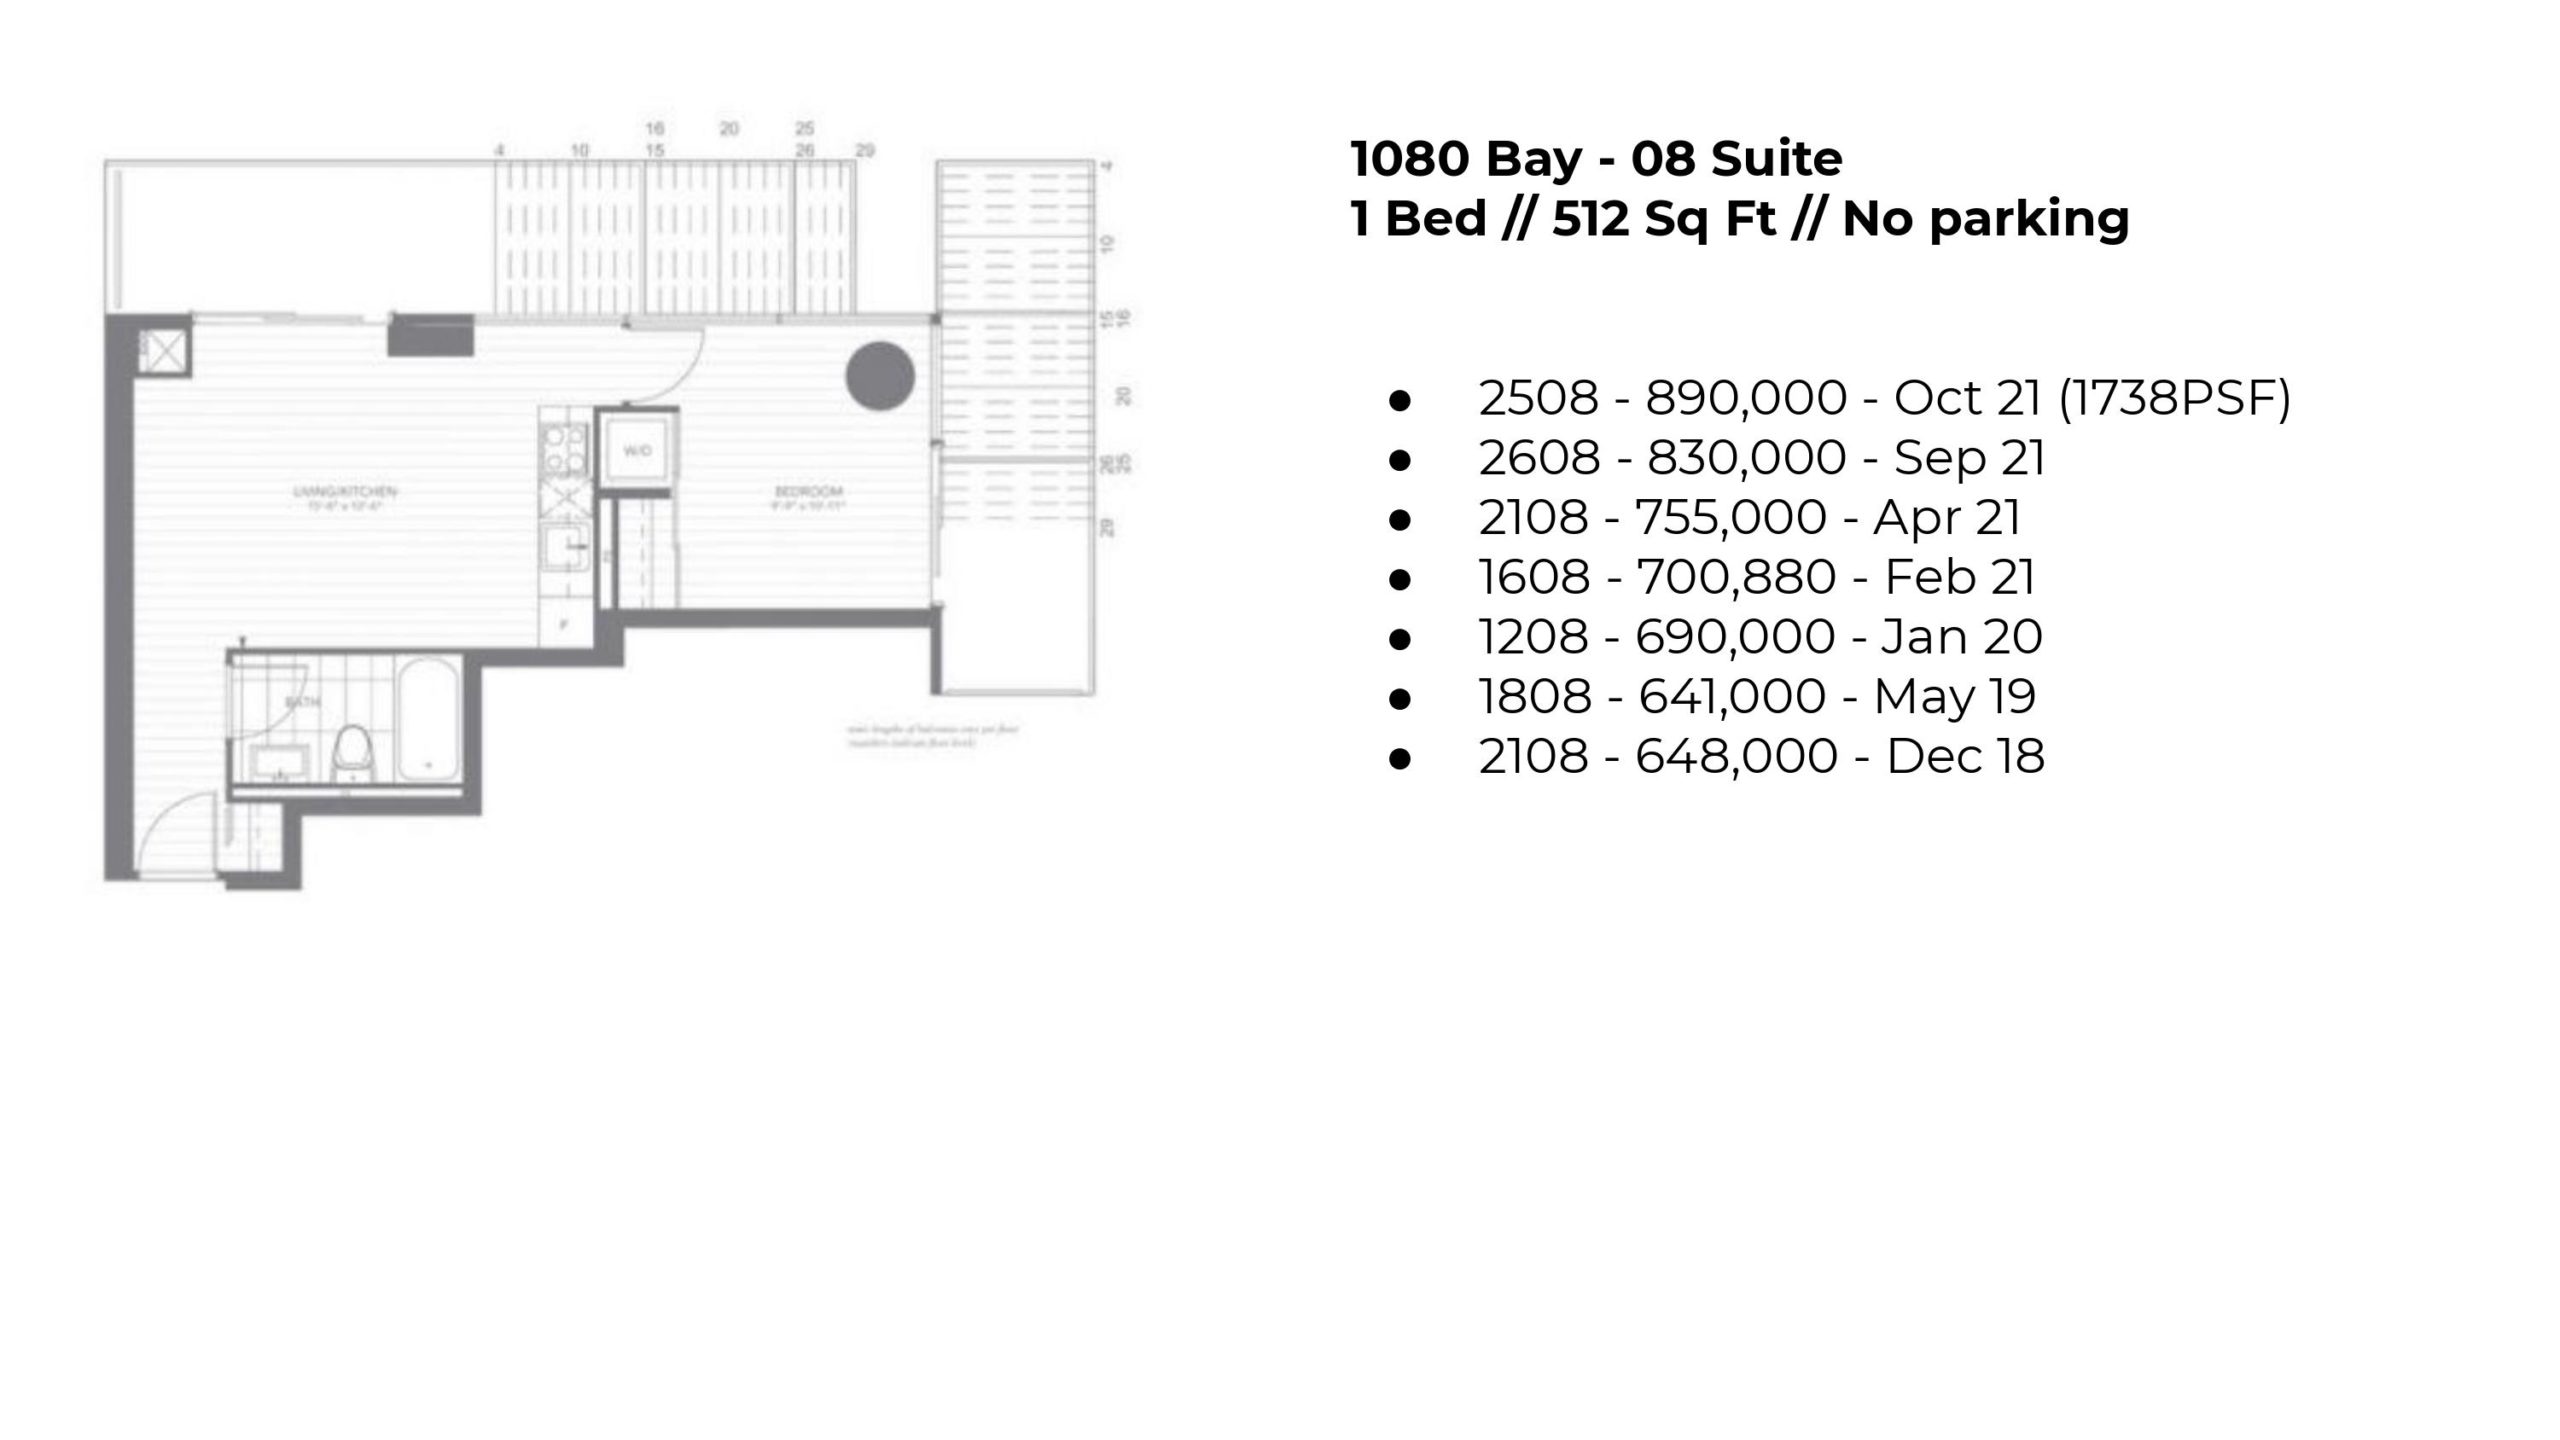
This 08 unit at 1080 Bay St just sold for $890K – putting it a whopping $1738 per square foot (we’re coming for you Vancouver)
At the pre-pandemic peak of the market in Jan/Feb of 2020, the same unit on the 12th floor sold for $690K
” but Jordon the recent sale is on a higher floor “
Granted, but even if you build in $50K in floor premium, we’re still at + $150K since the previous market “peak”
Other units show similar stories too:
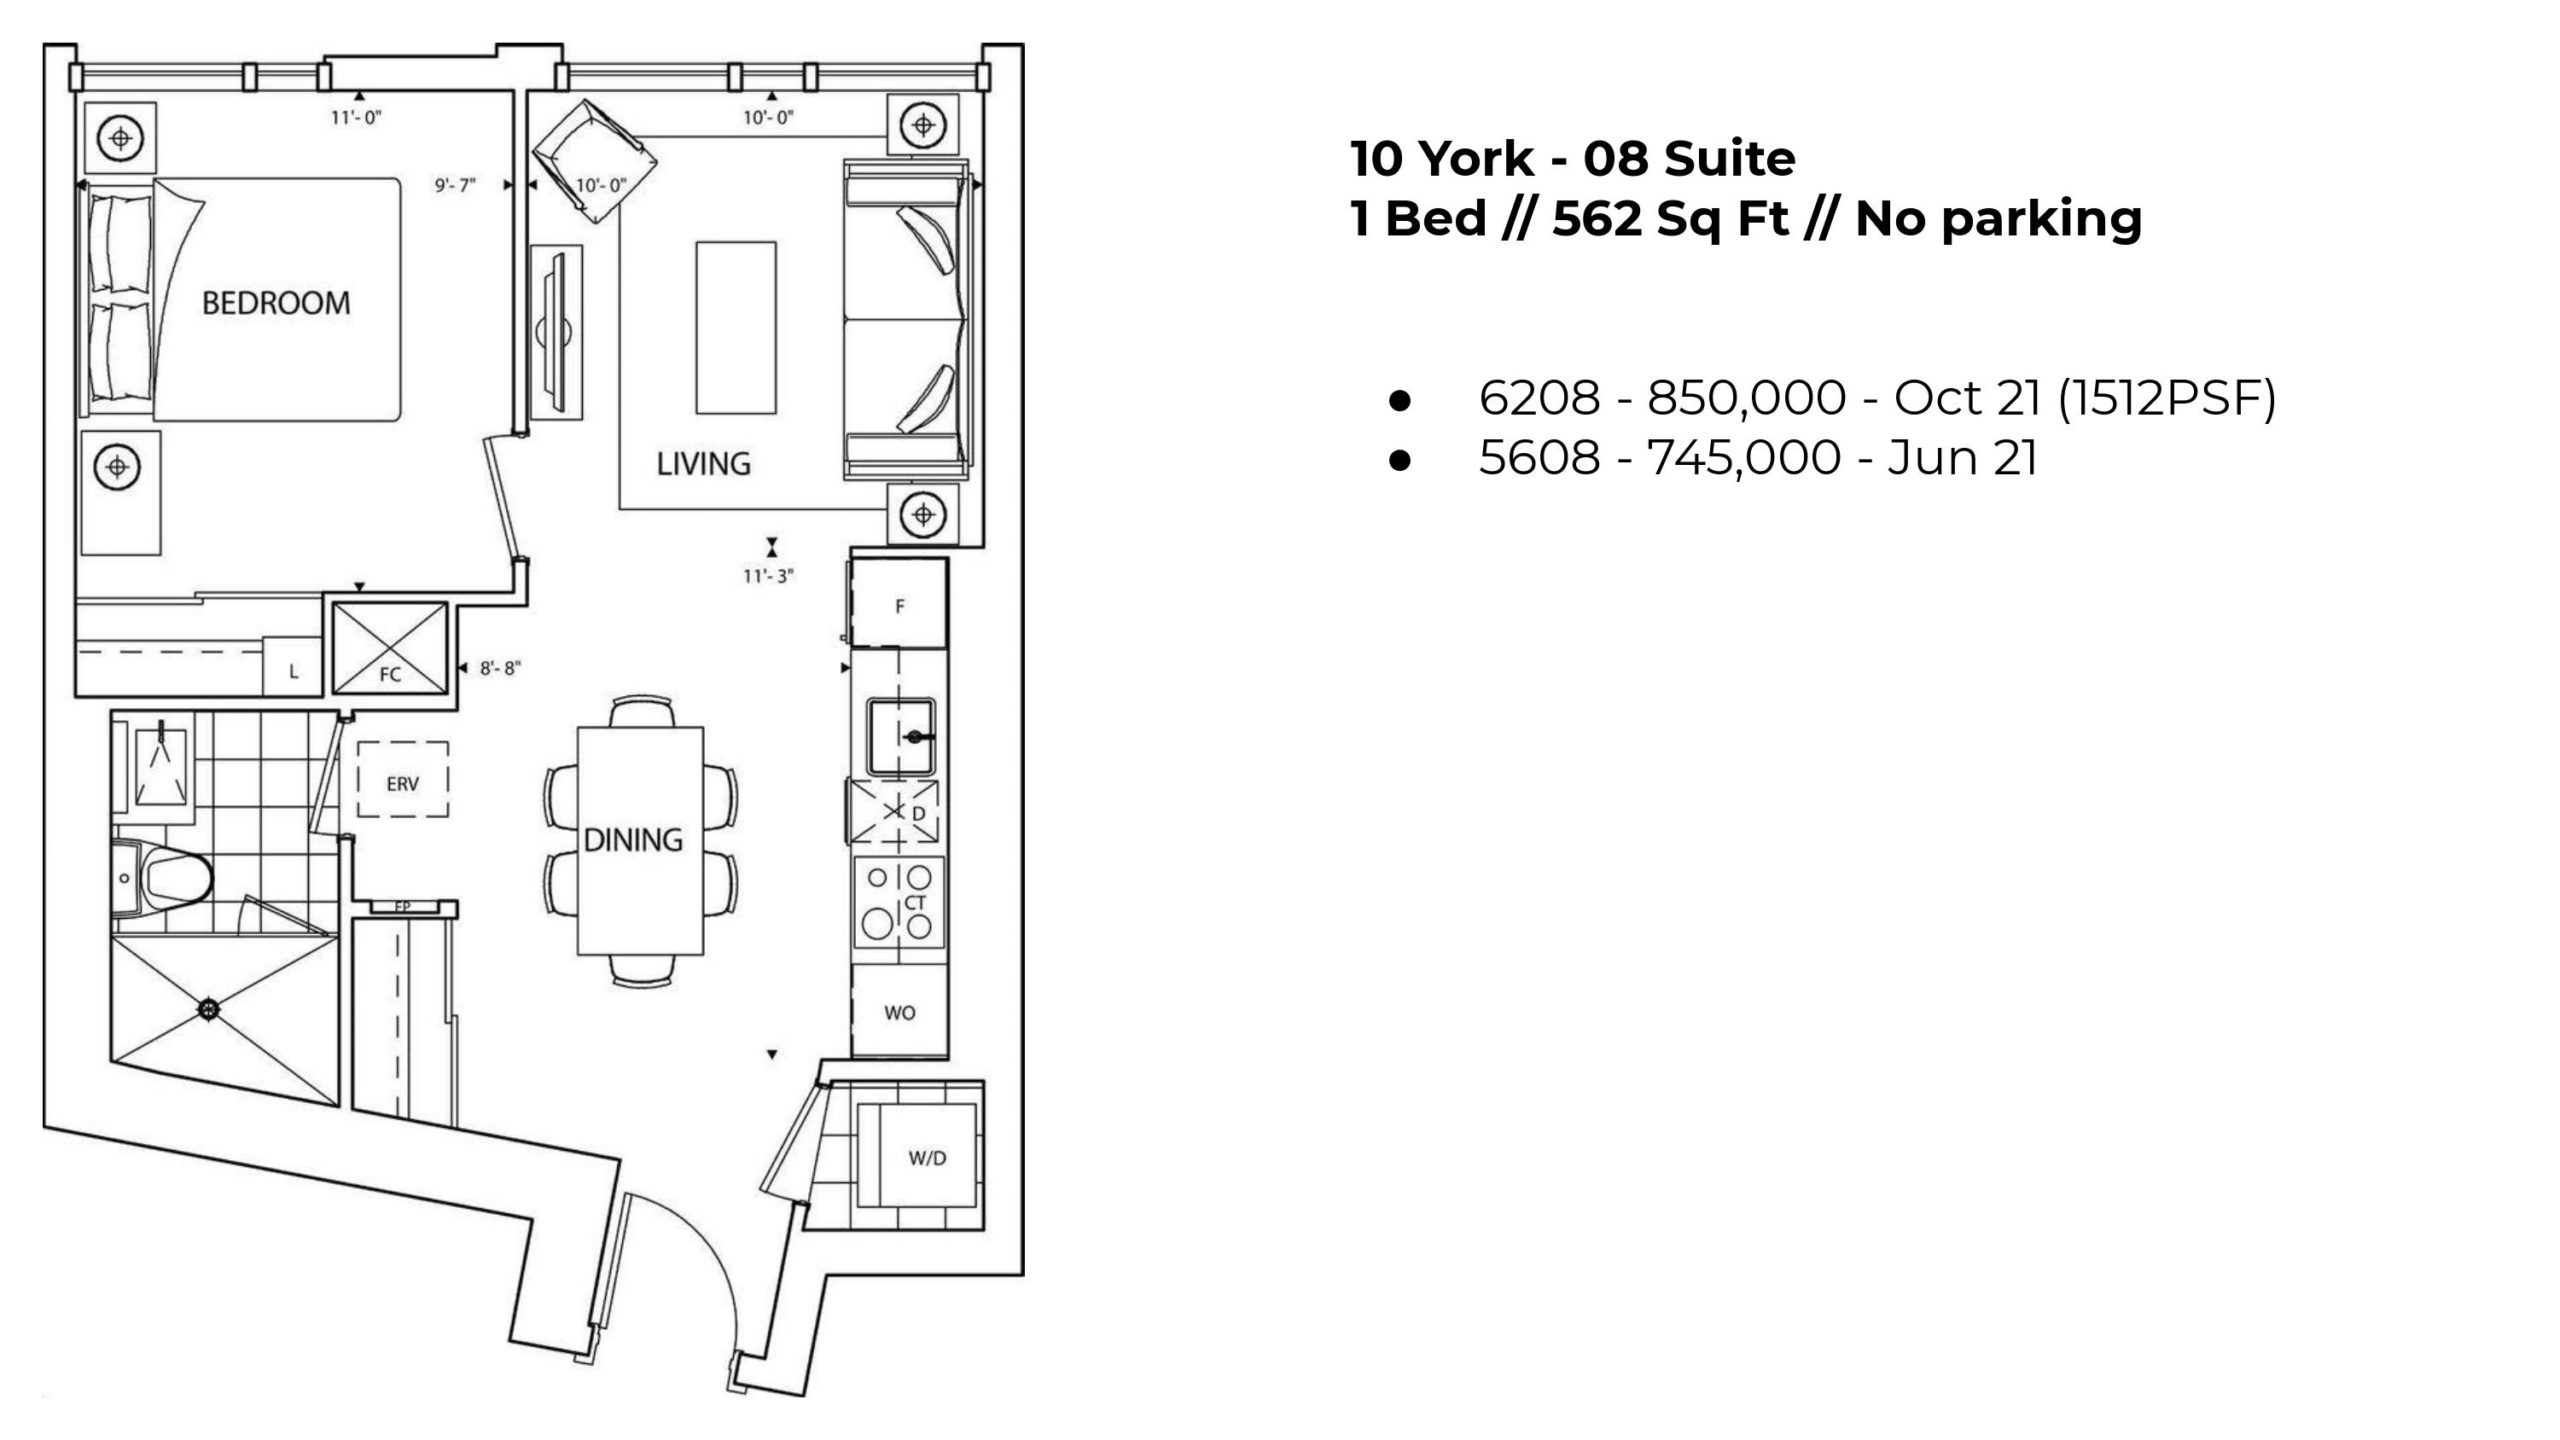
The downtown waterfront buildings have been doing particularly well in the last little bit
This unit here at ten york sold for over $1500 per ft
That’s wild – Ten York was not getting 1500PSF prior to the pandemic, ever
But enough about specific examples, let’s move on to the rental market
The short version – it’s recovering, but we’re still ~10% depressed in rental rate versus pre covid numbers
Rental Market Update
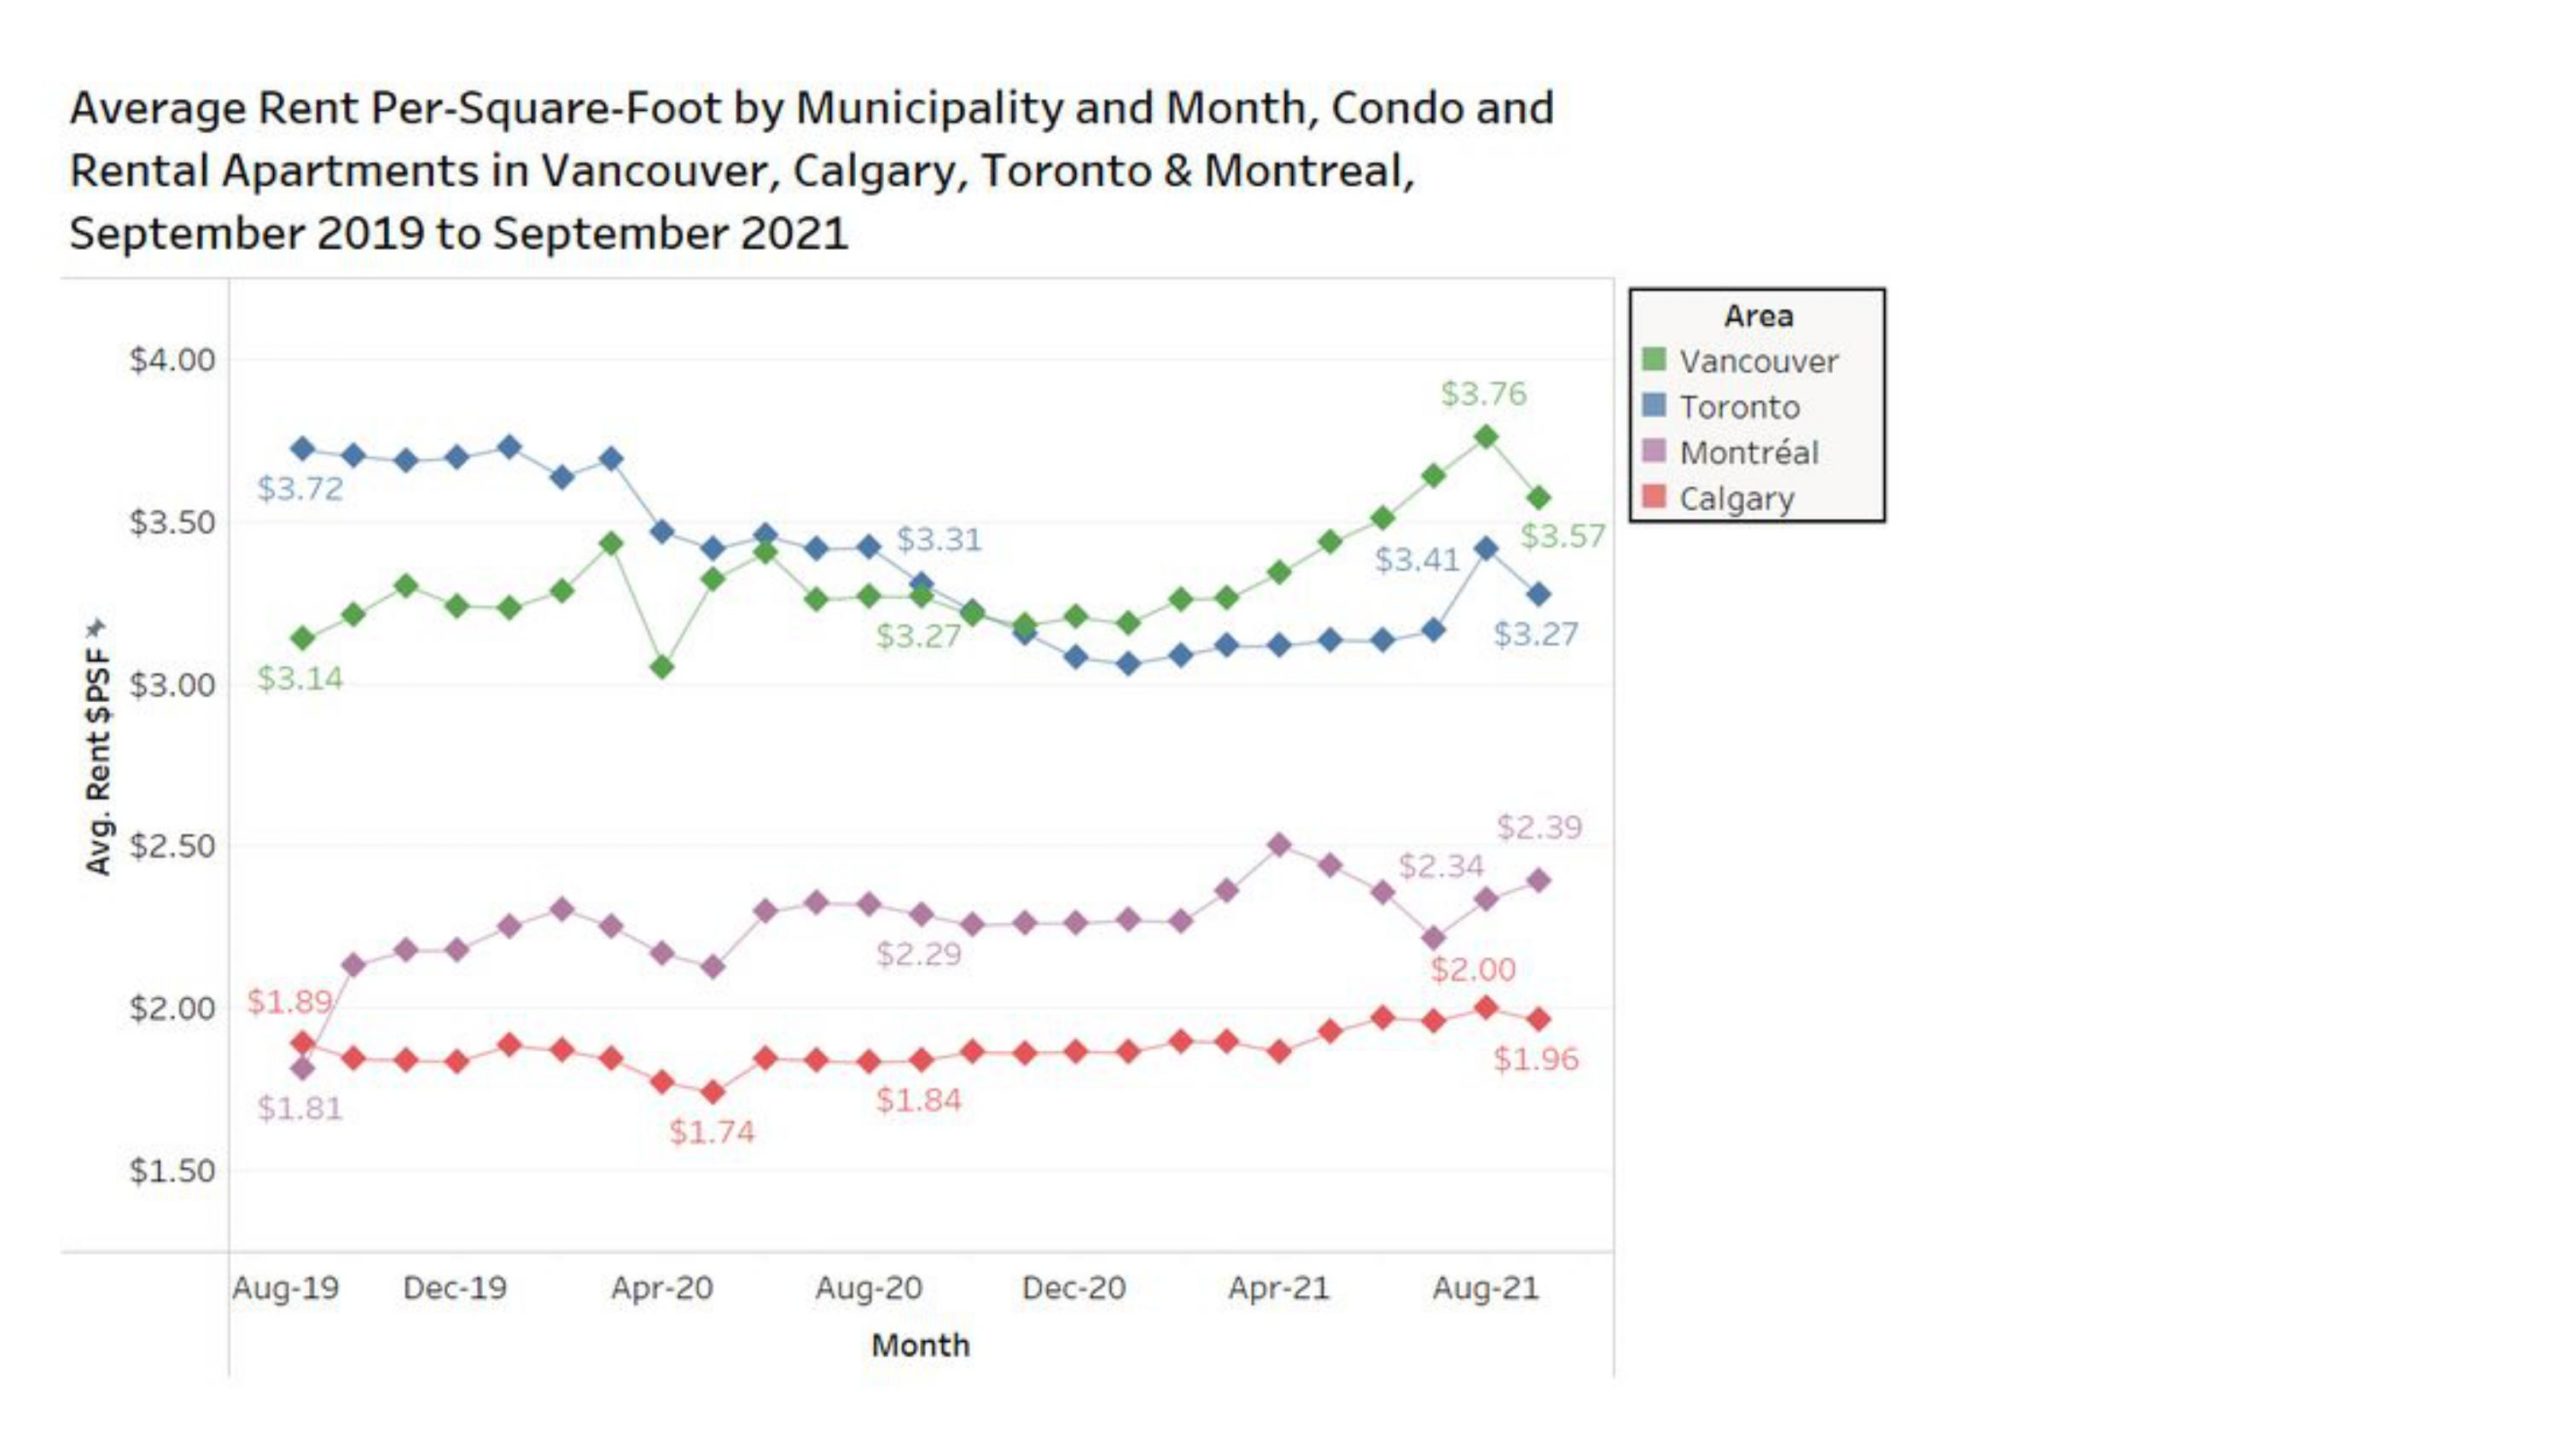
On average, Toronto condos/apartments were getting upwards of $3.72 per sq ft / m prior to the pandemic
Now we’re averaging around $3.30 per ft
You can see we’re starting to recover in the rental market, and inventory is back to historical norms (for the most part) see below
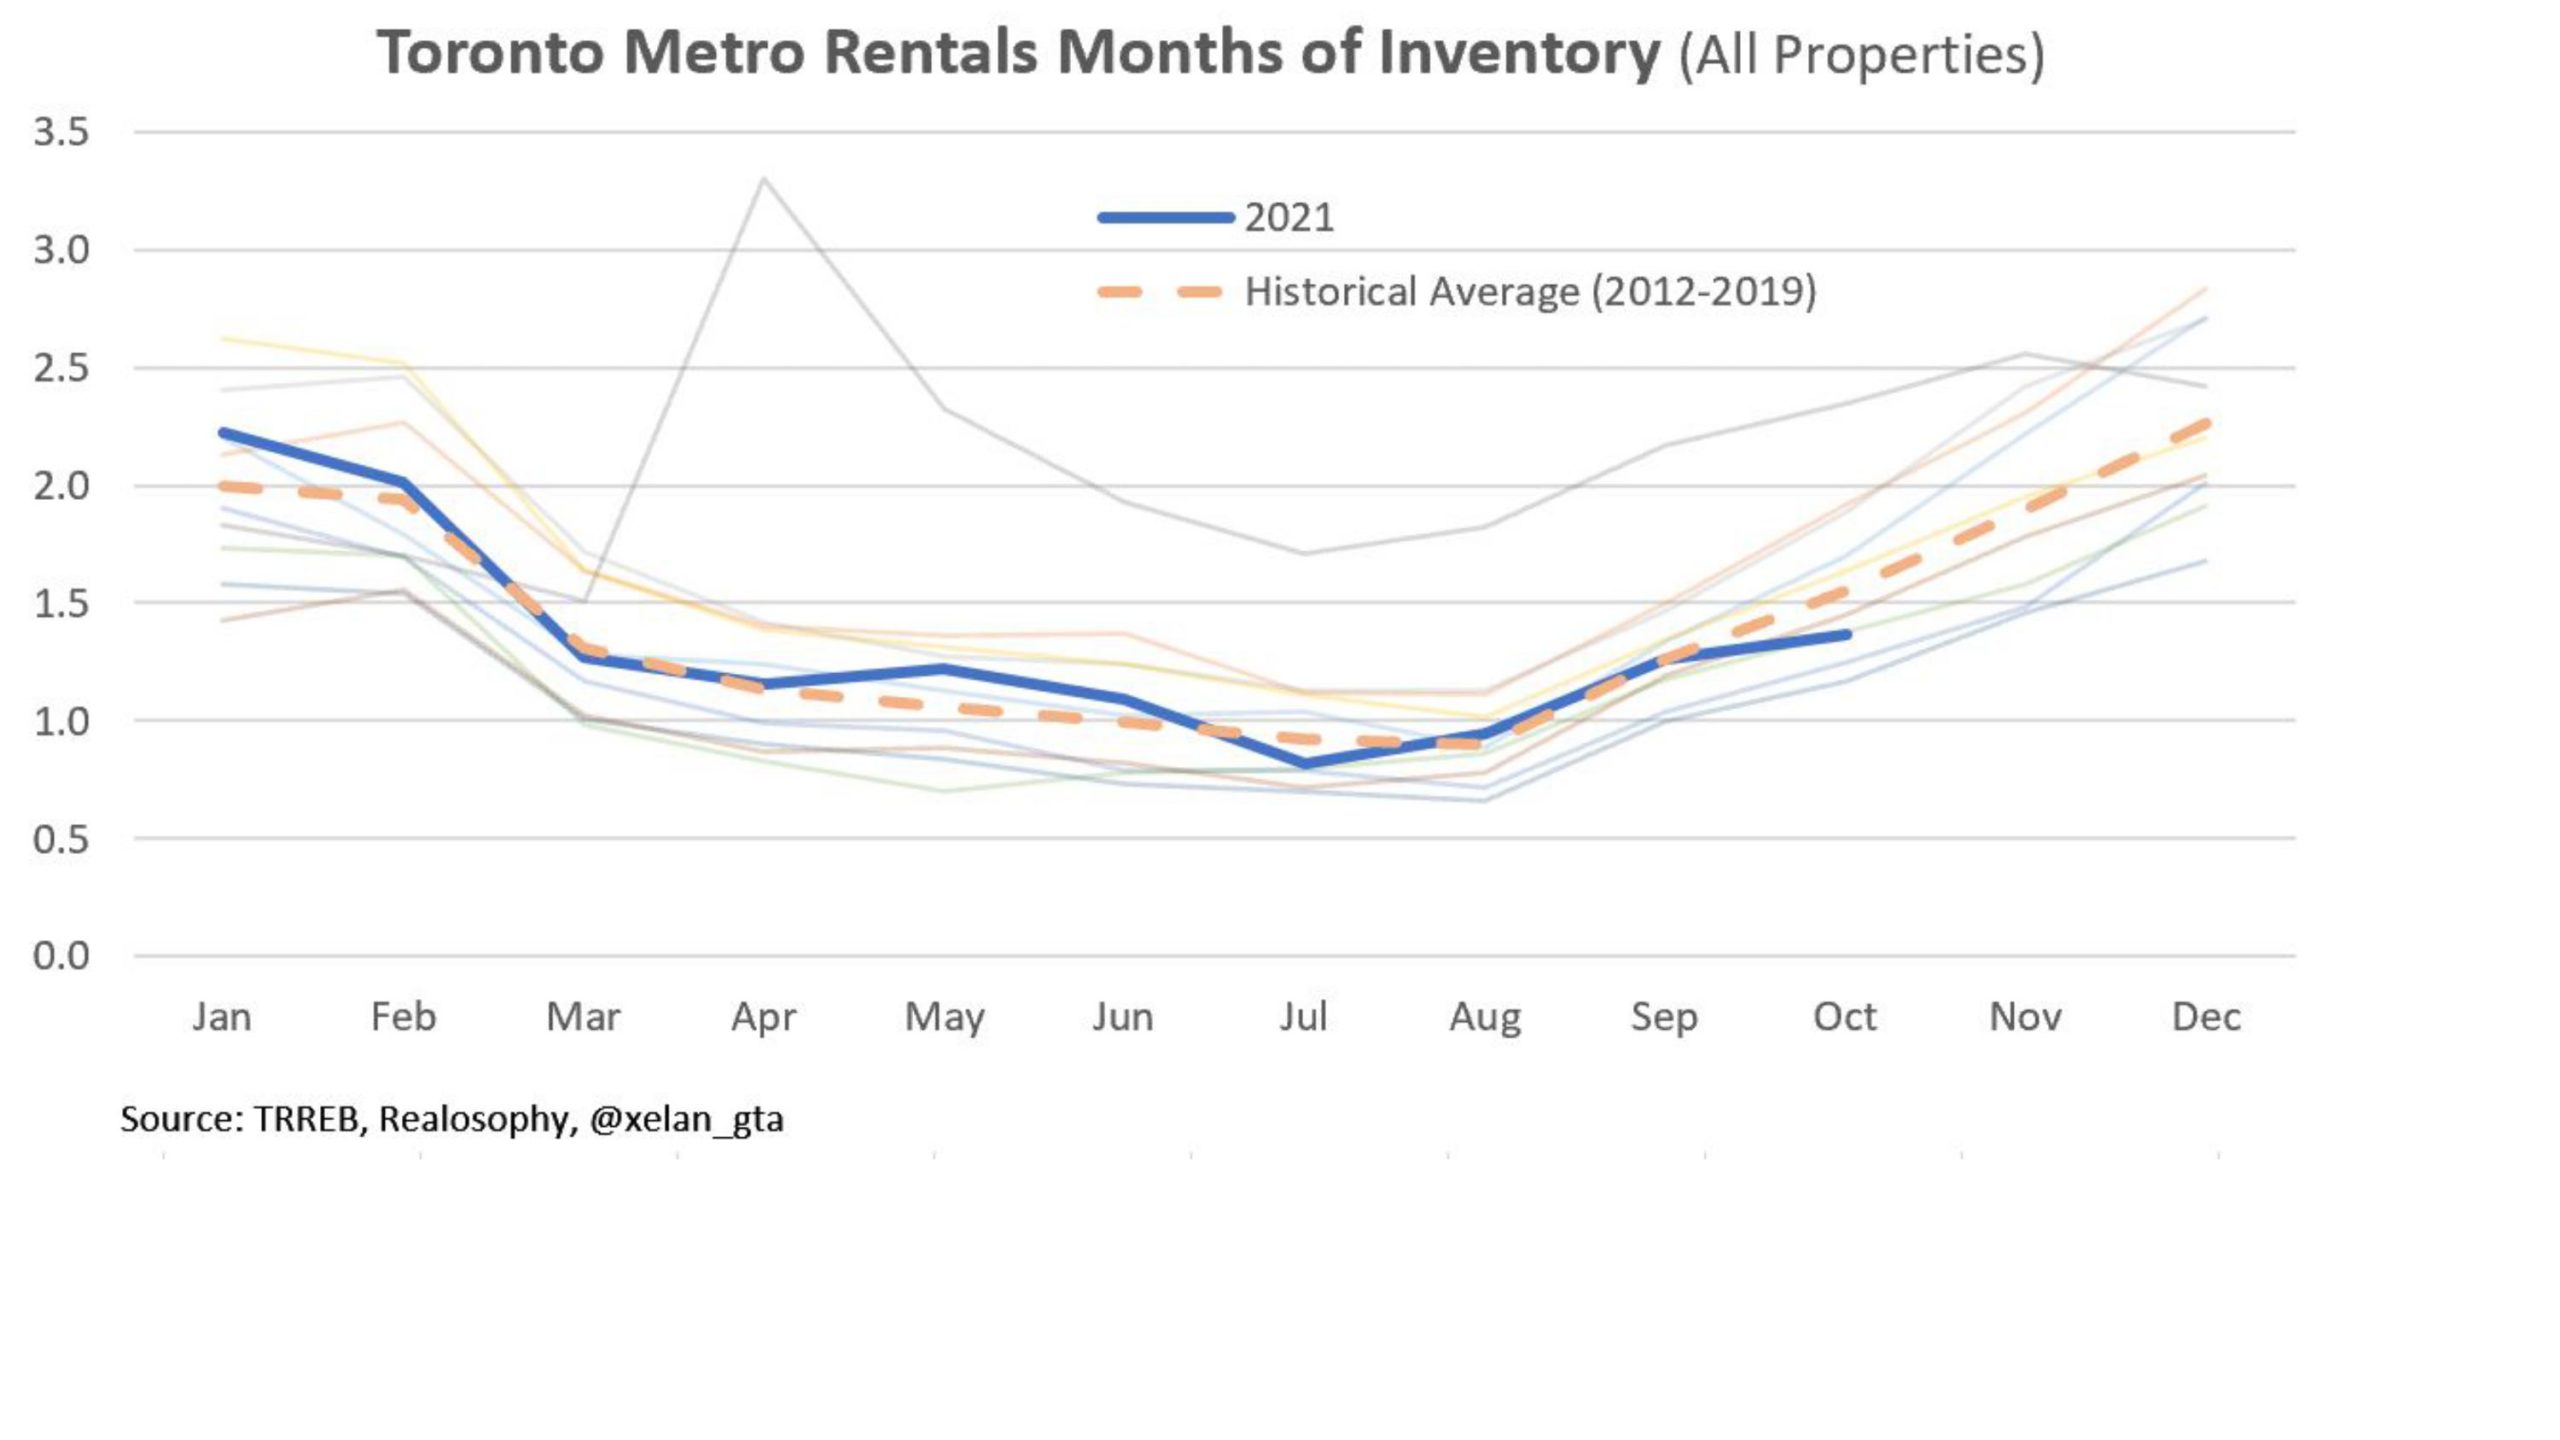
The blue line is this year, and that grey line way above historical norms is the rental inventory (represented as MOI) last year
We saw a huge influx of rental inventory as people fled downtown, and as many Airbnb properties were listed on the LTR market (long term rental)
With rental MOI back in historical normal bounds, and with immigration targets being hit, I suspect we’ll see a fairly quick recovery to normal rental rates
That’s it for this market update!
If you’re interested in my take on the rate hikes coming next year + a more detailed view into the supply and demand fundamentals of the pre-construction condo market, please watch the video update here.
Thanks for reading!